Music: “The Language of Cities” by Maserati
1. The Animation
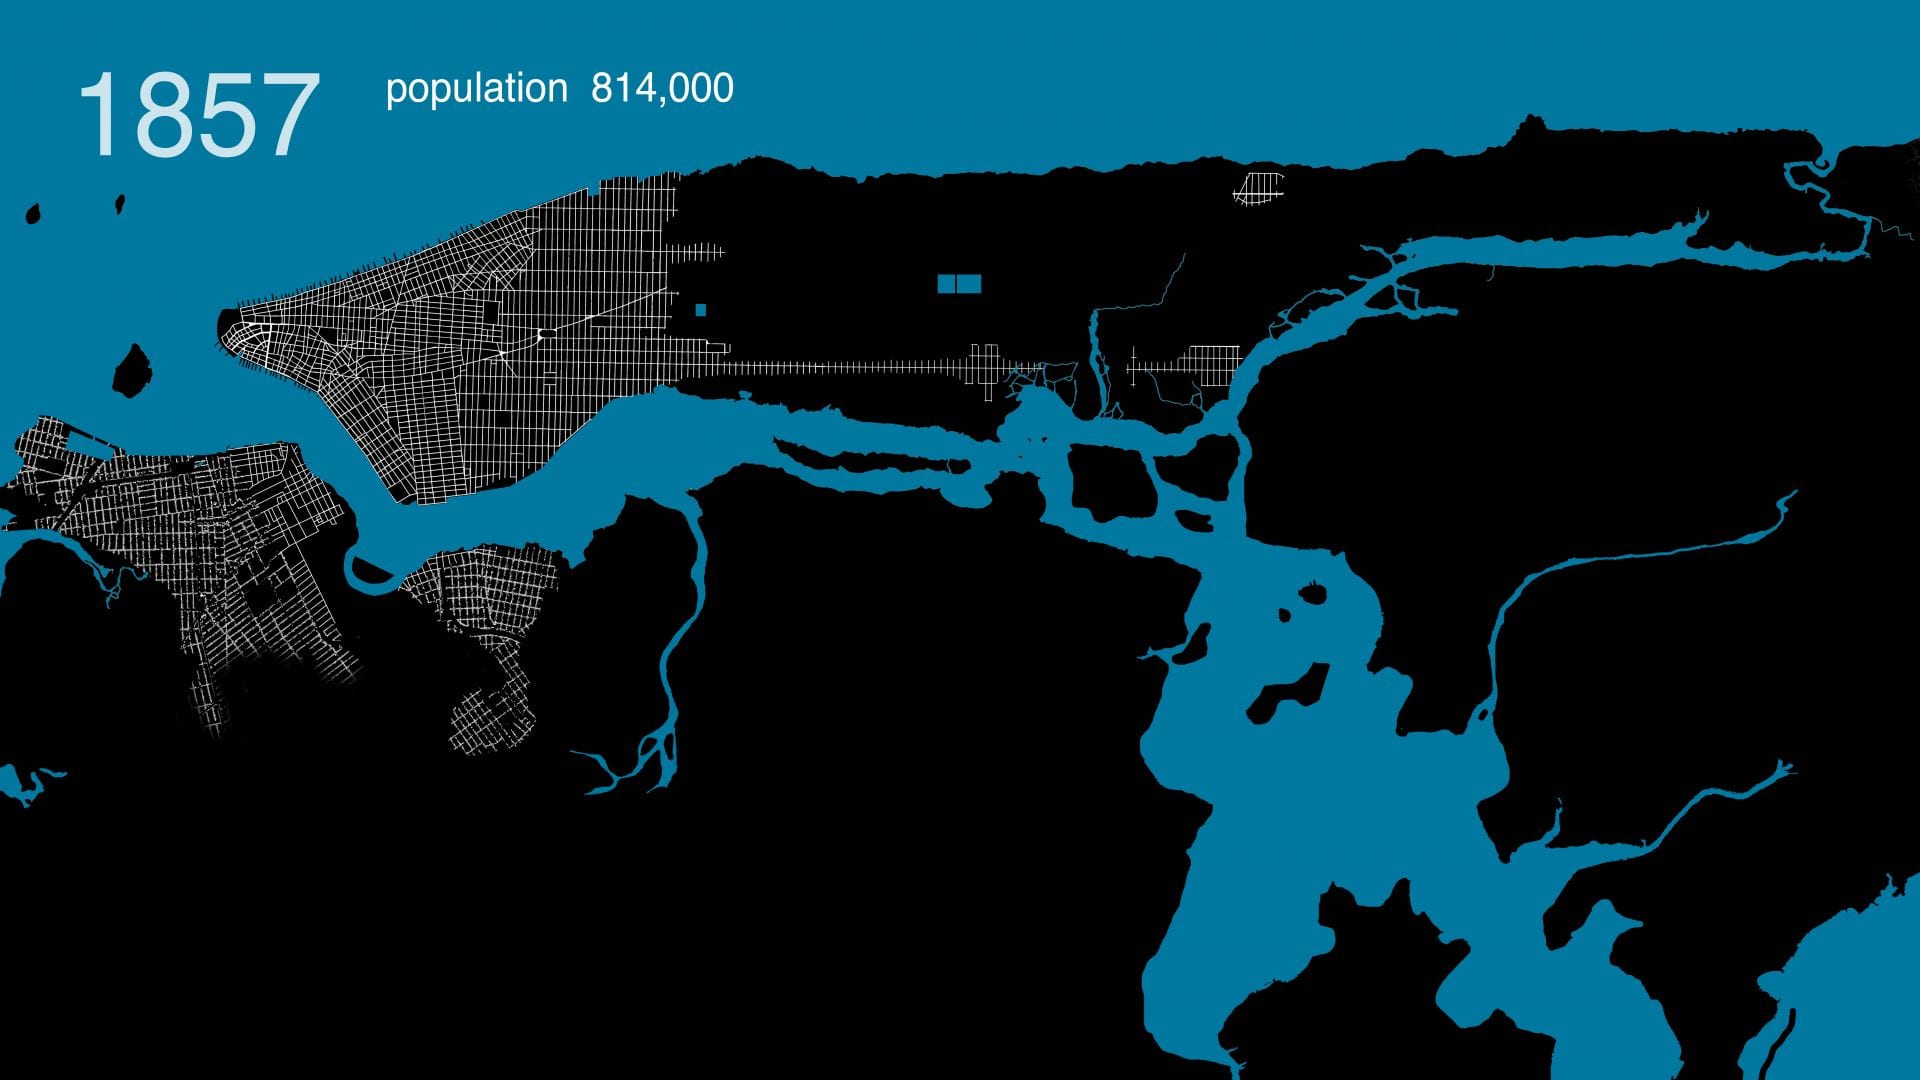
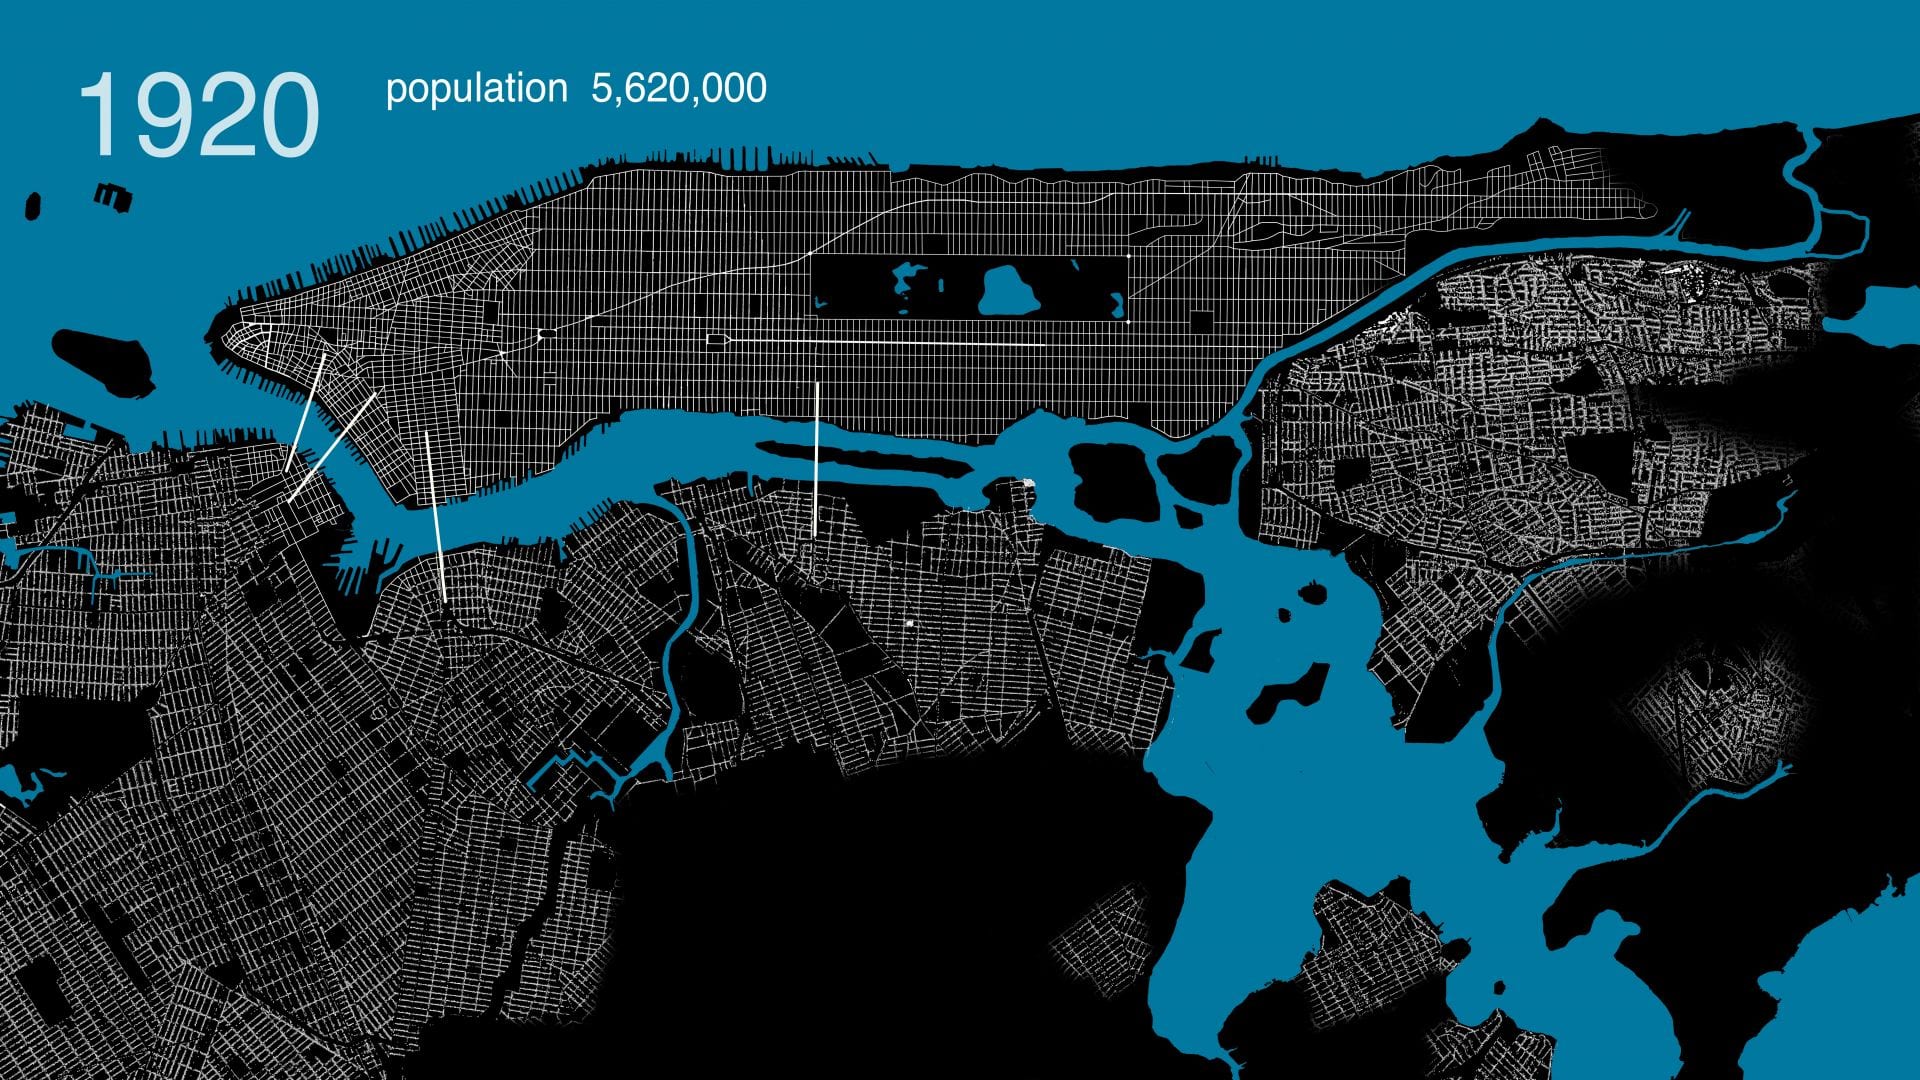
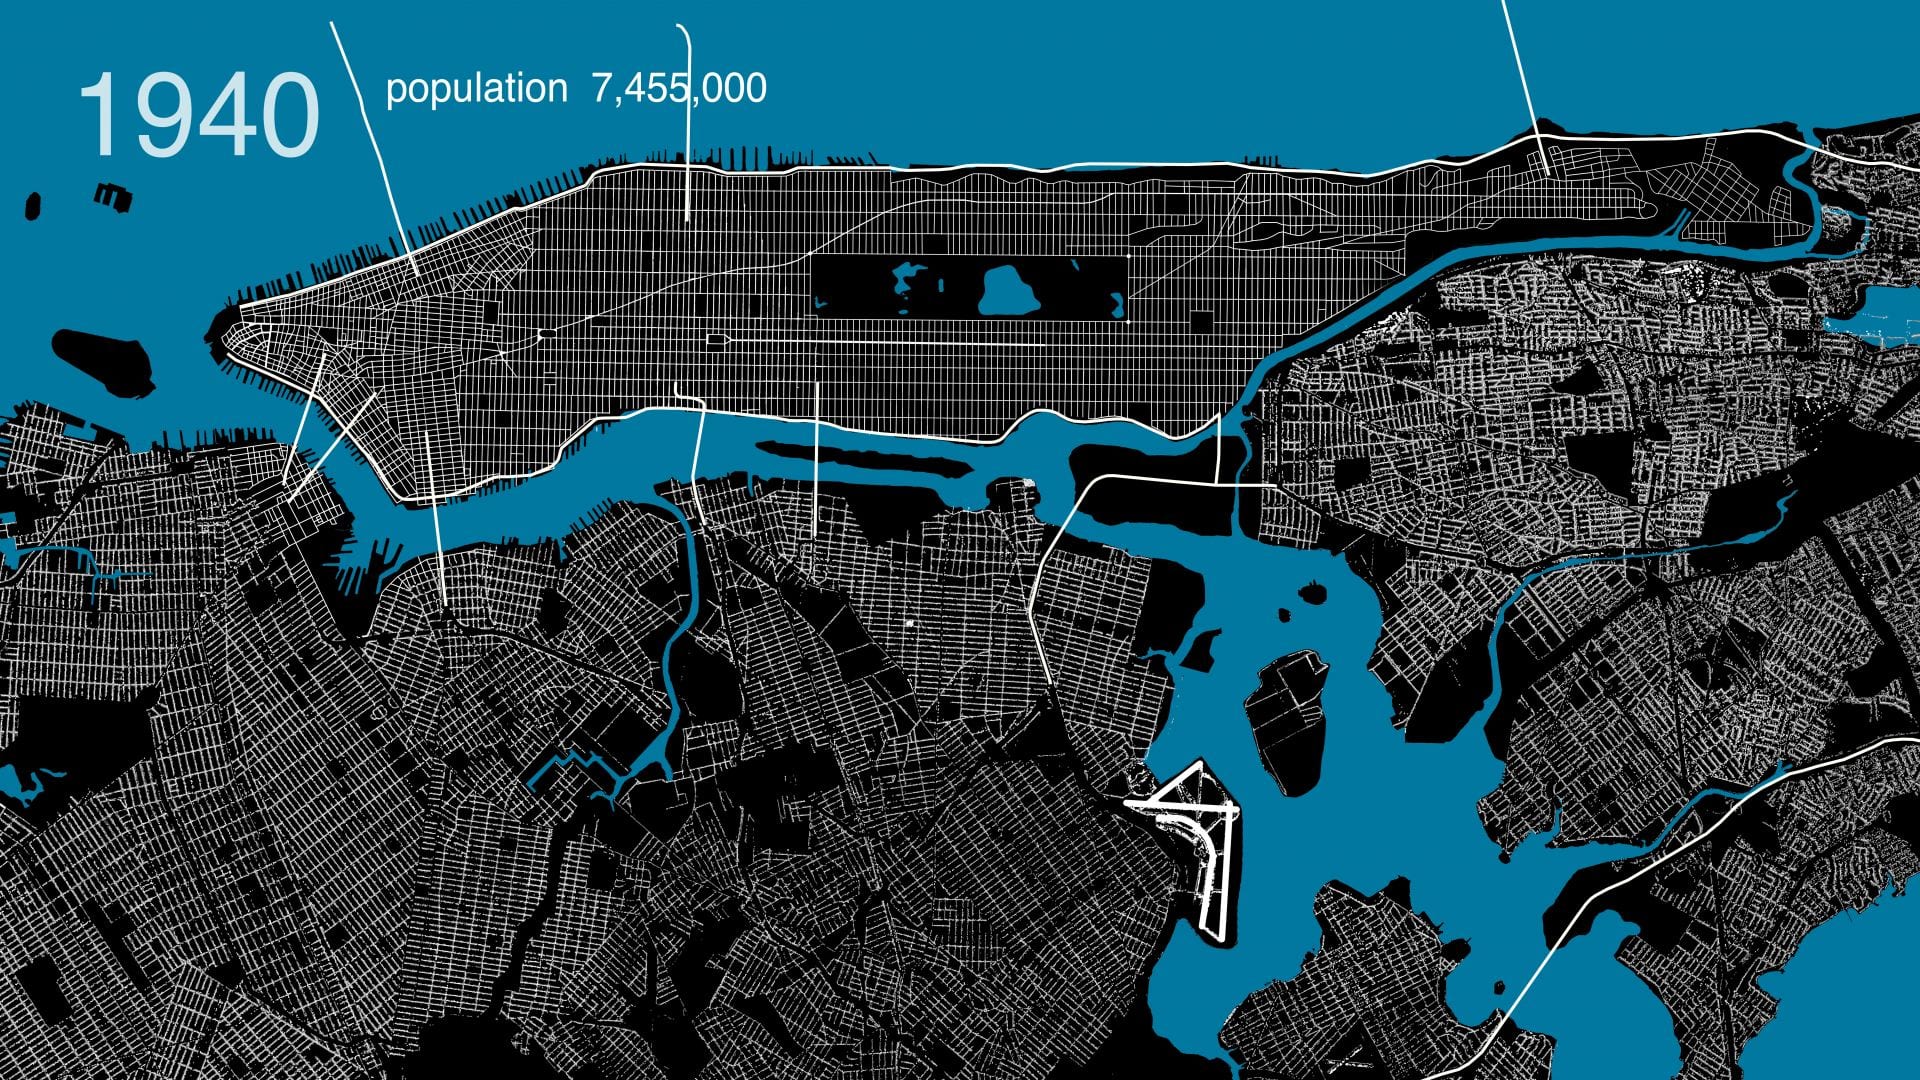
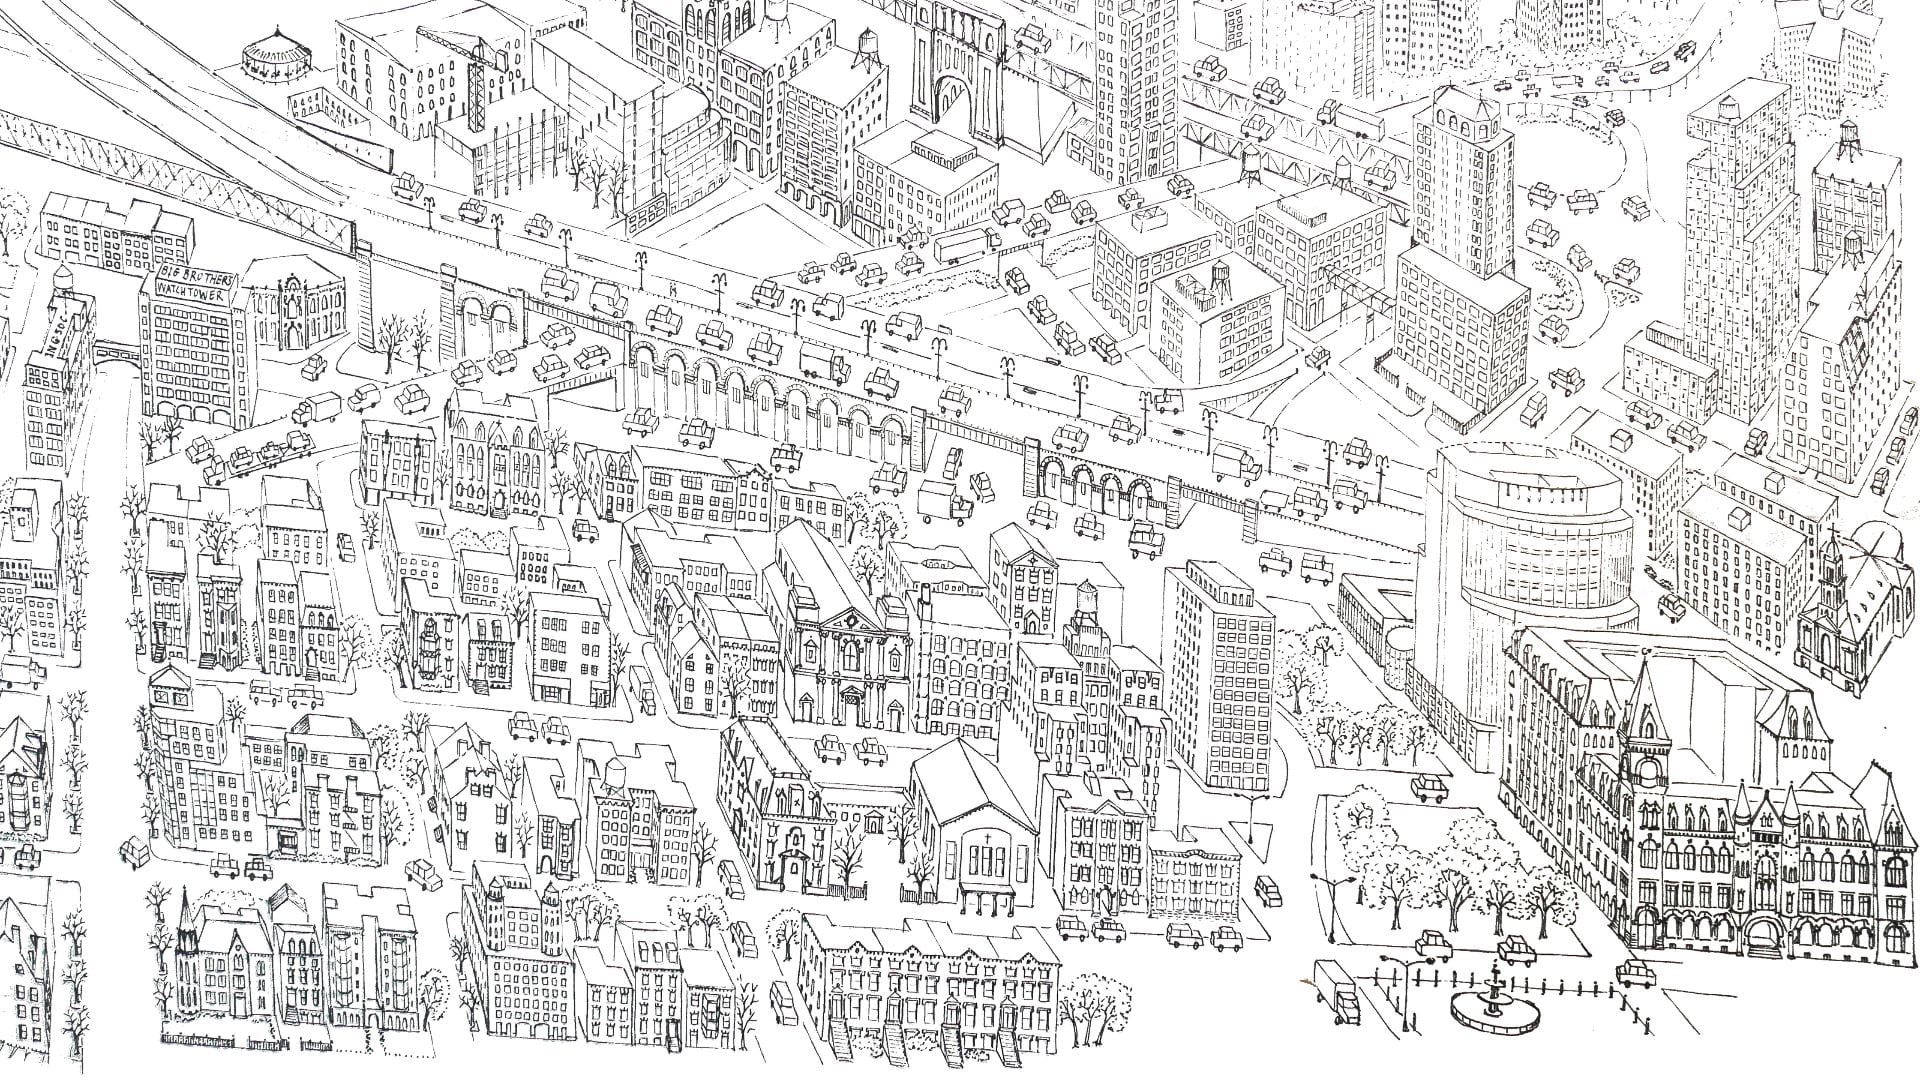
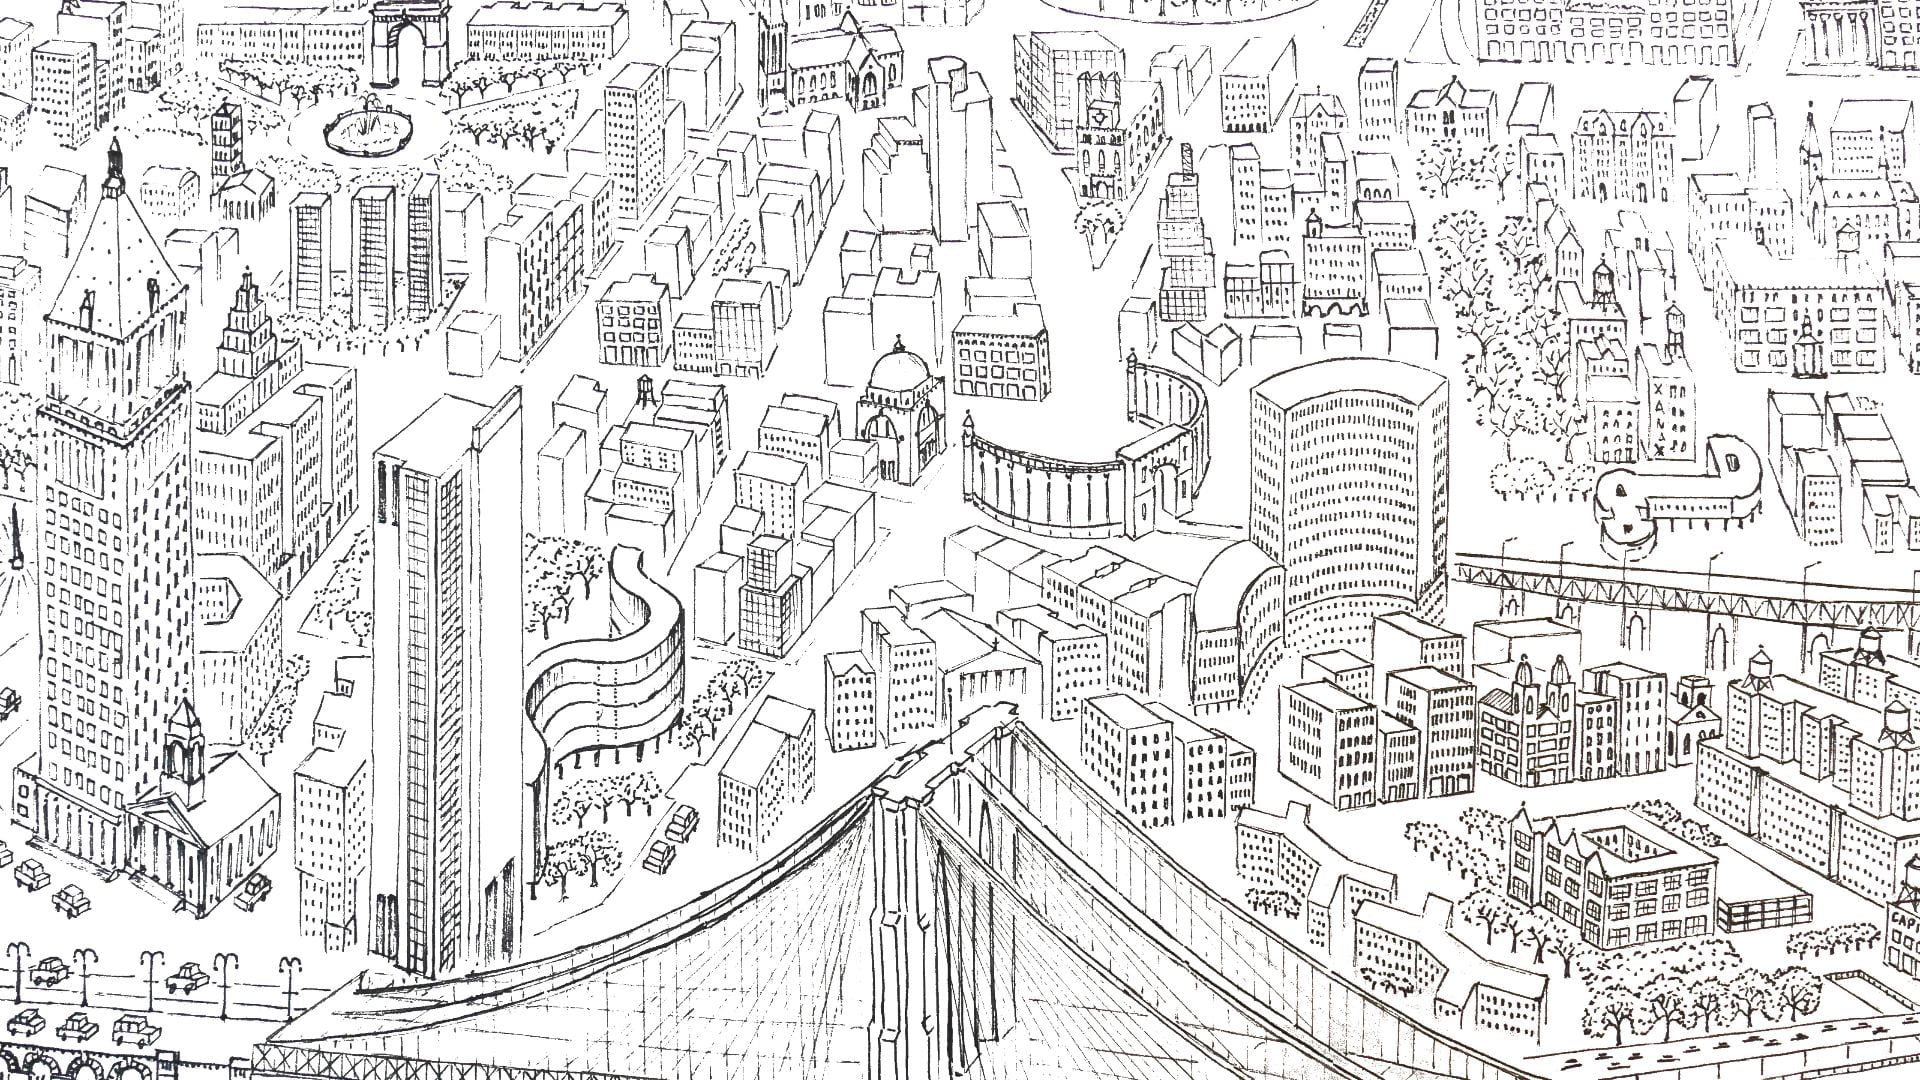
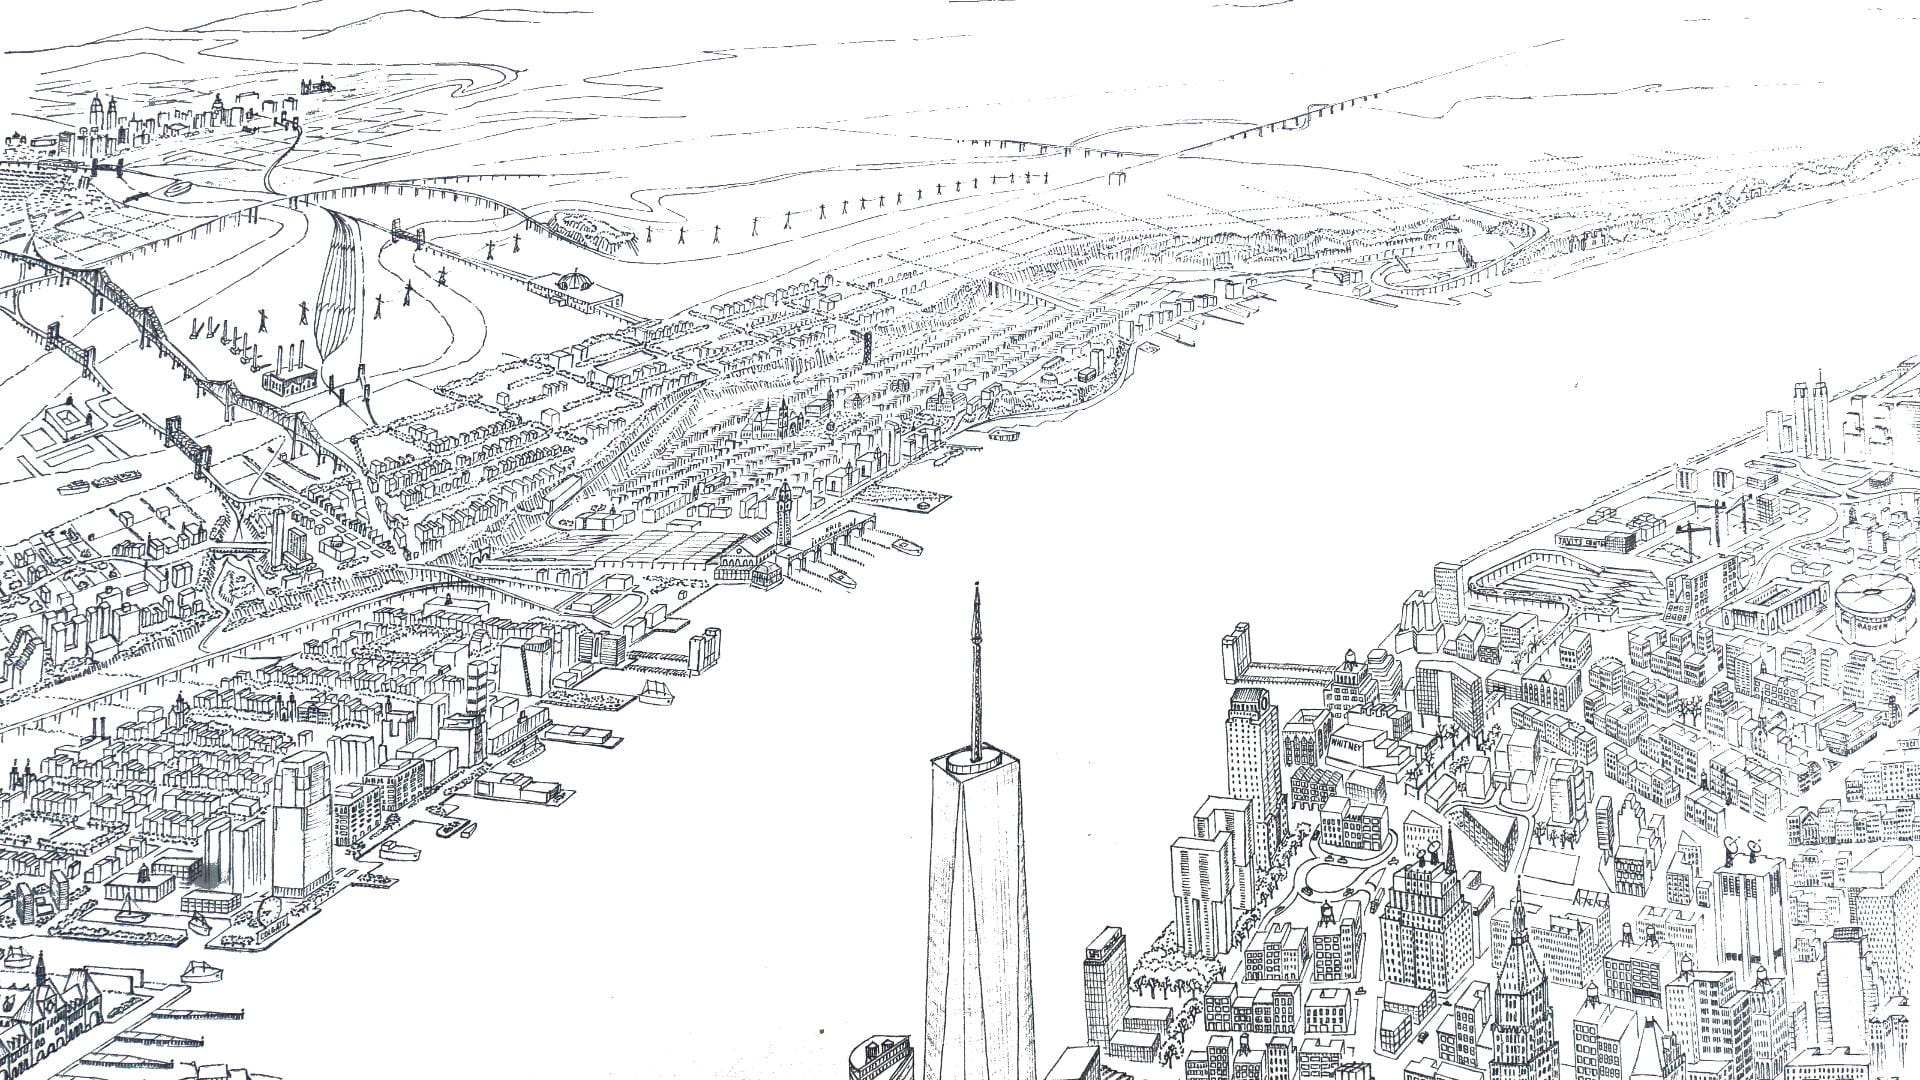
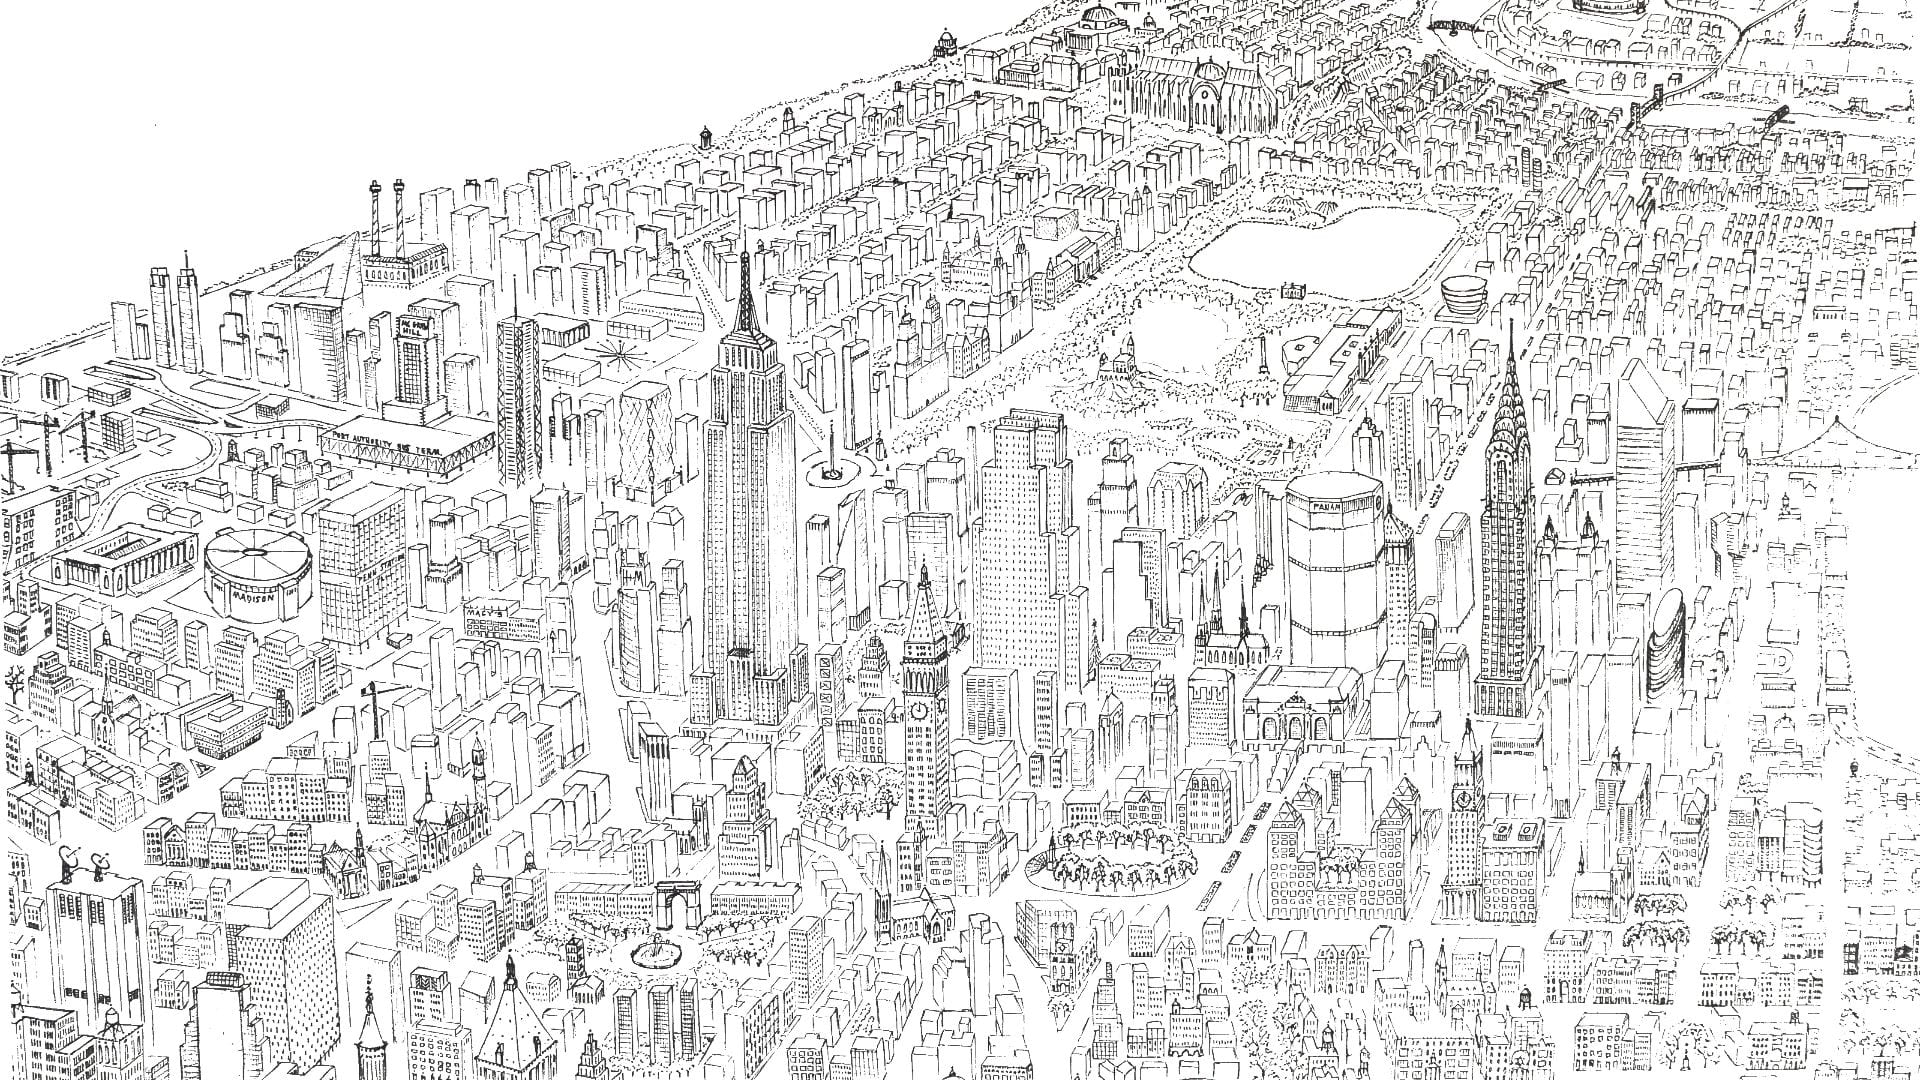
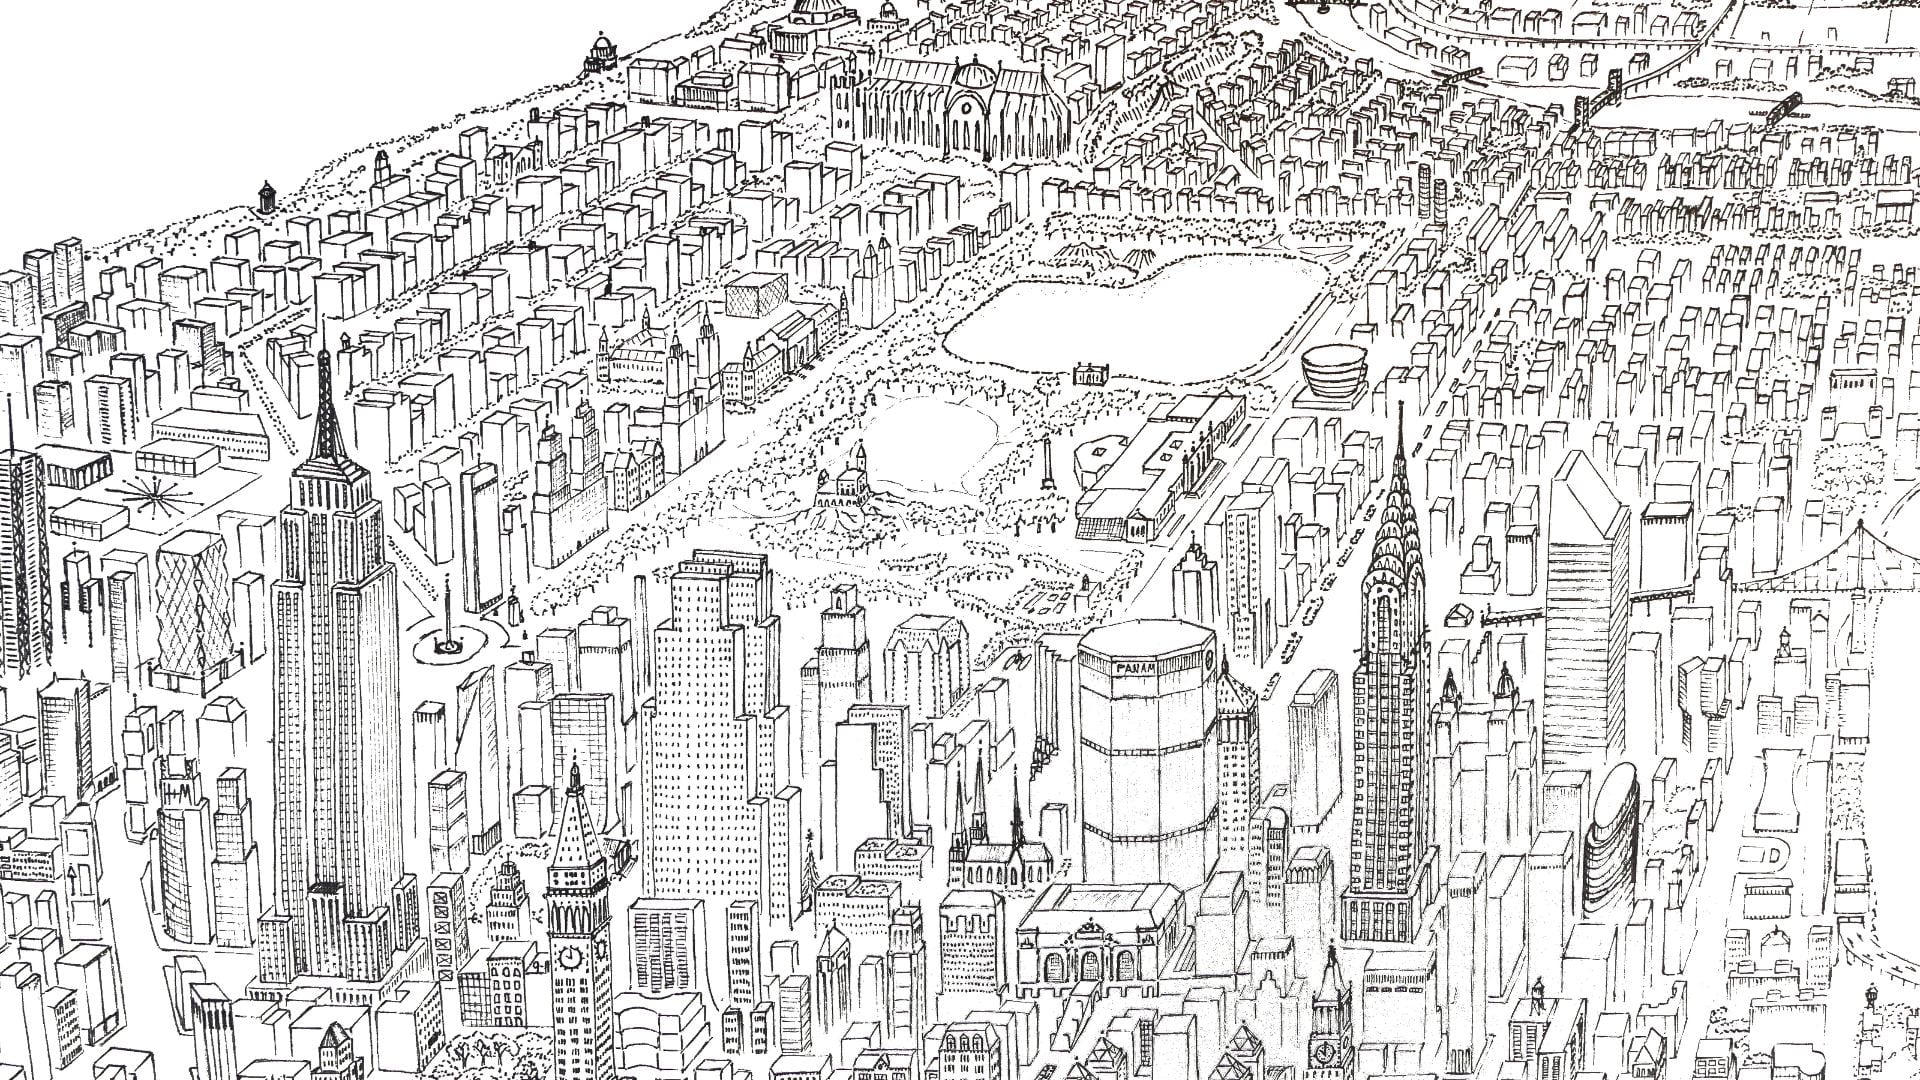
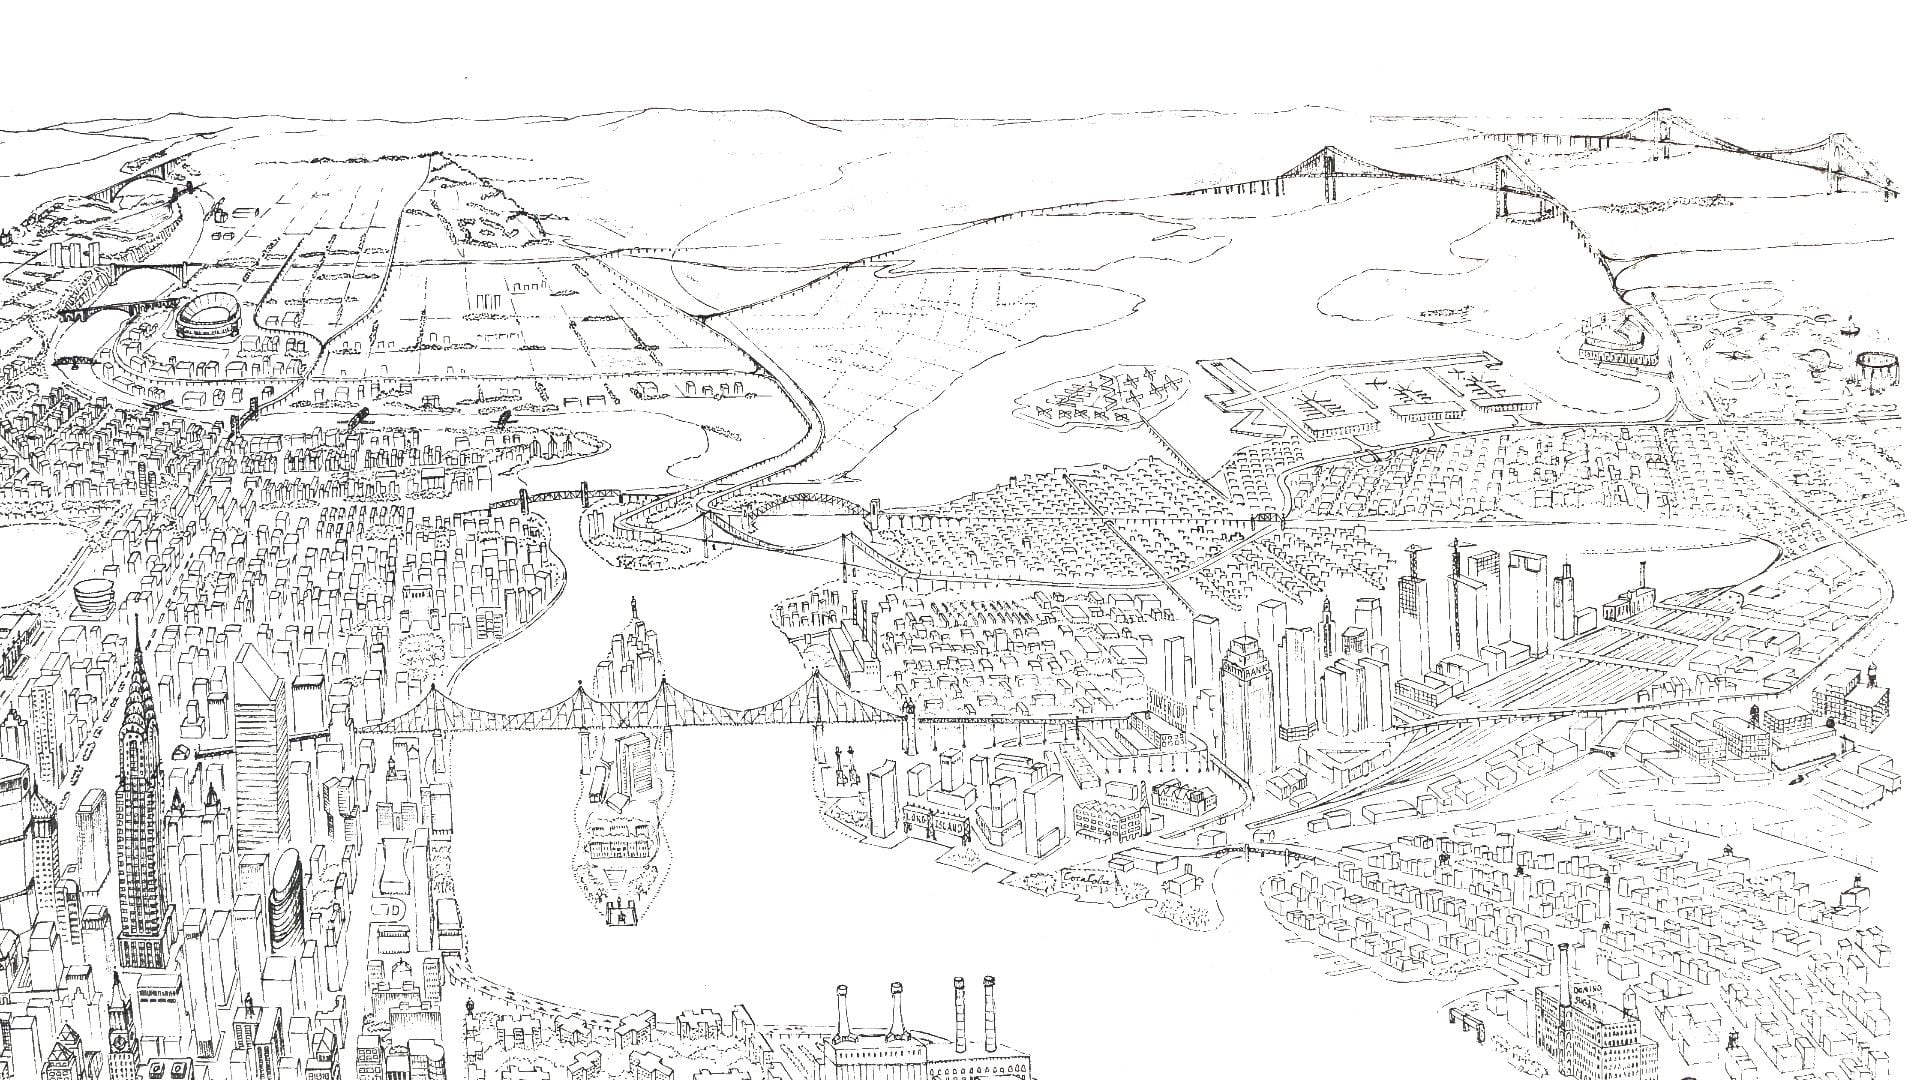
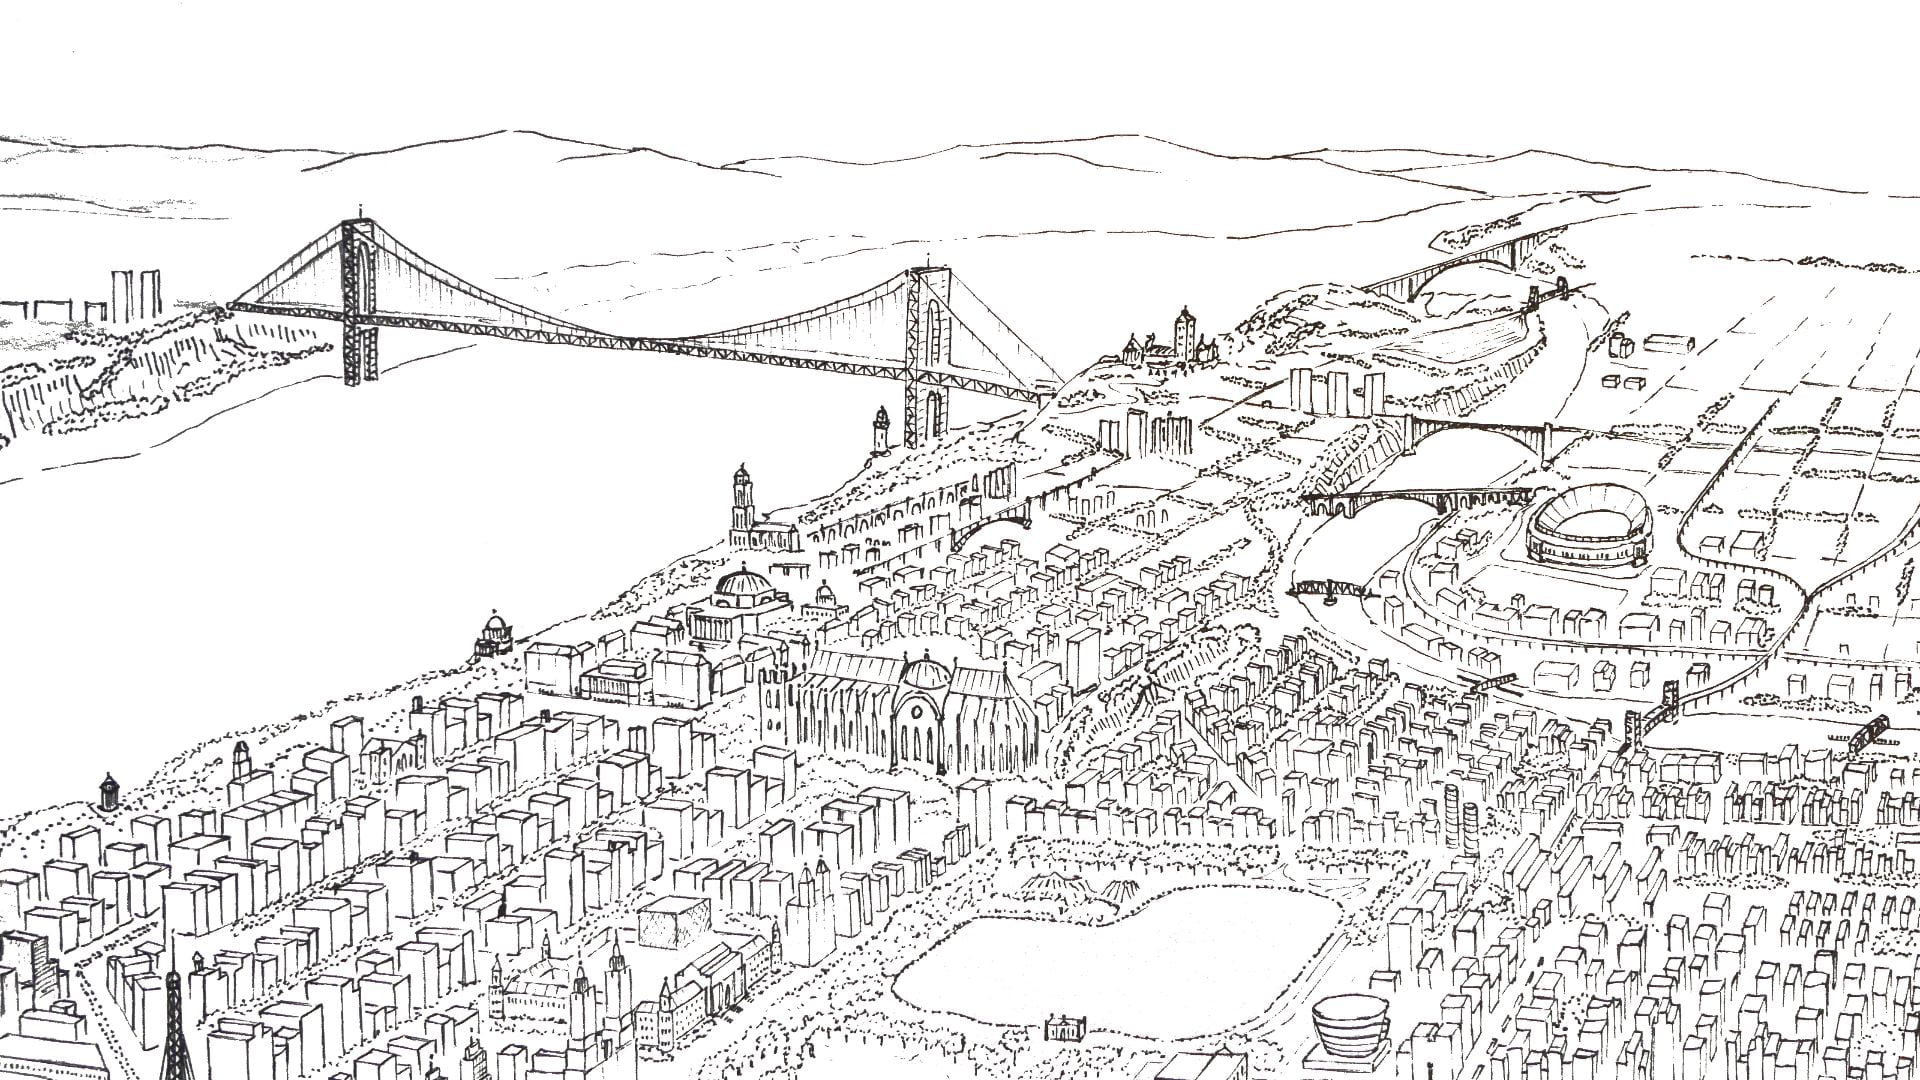
Here Grows New York visually animates the development of this city’s street grid and environment from 1609 to the present day, using geo-referenced road network data, historic maps, and geological surveys. The resulting short film presents a series of “cartographic snapshots” of the built-up environment at intervals of every 20 to 30 years in history. This process highlights the organic spurts of growth and movement that typify New York’s and most cities’ development through time. The result is an abstract representation of urbanism.
.

.
3. Research Method
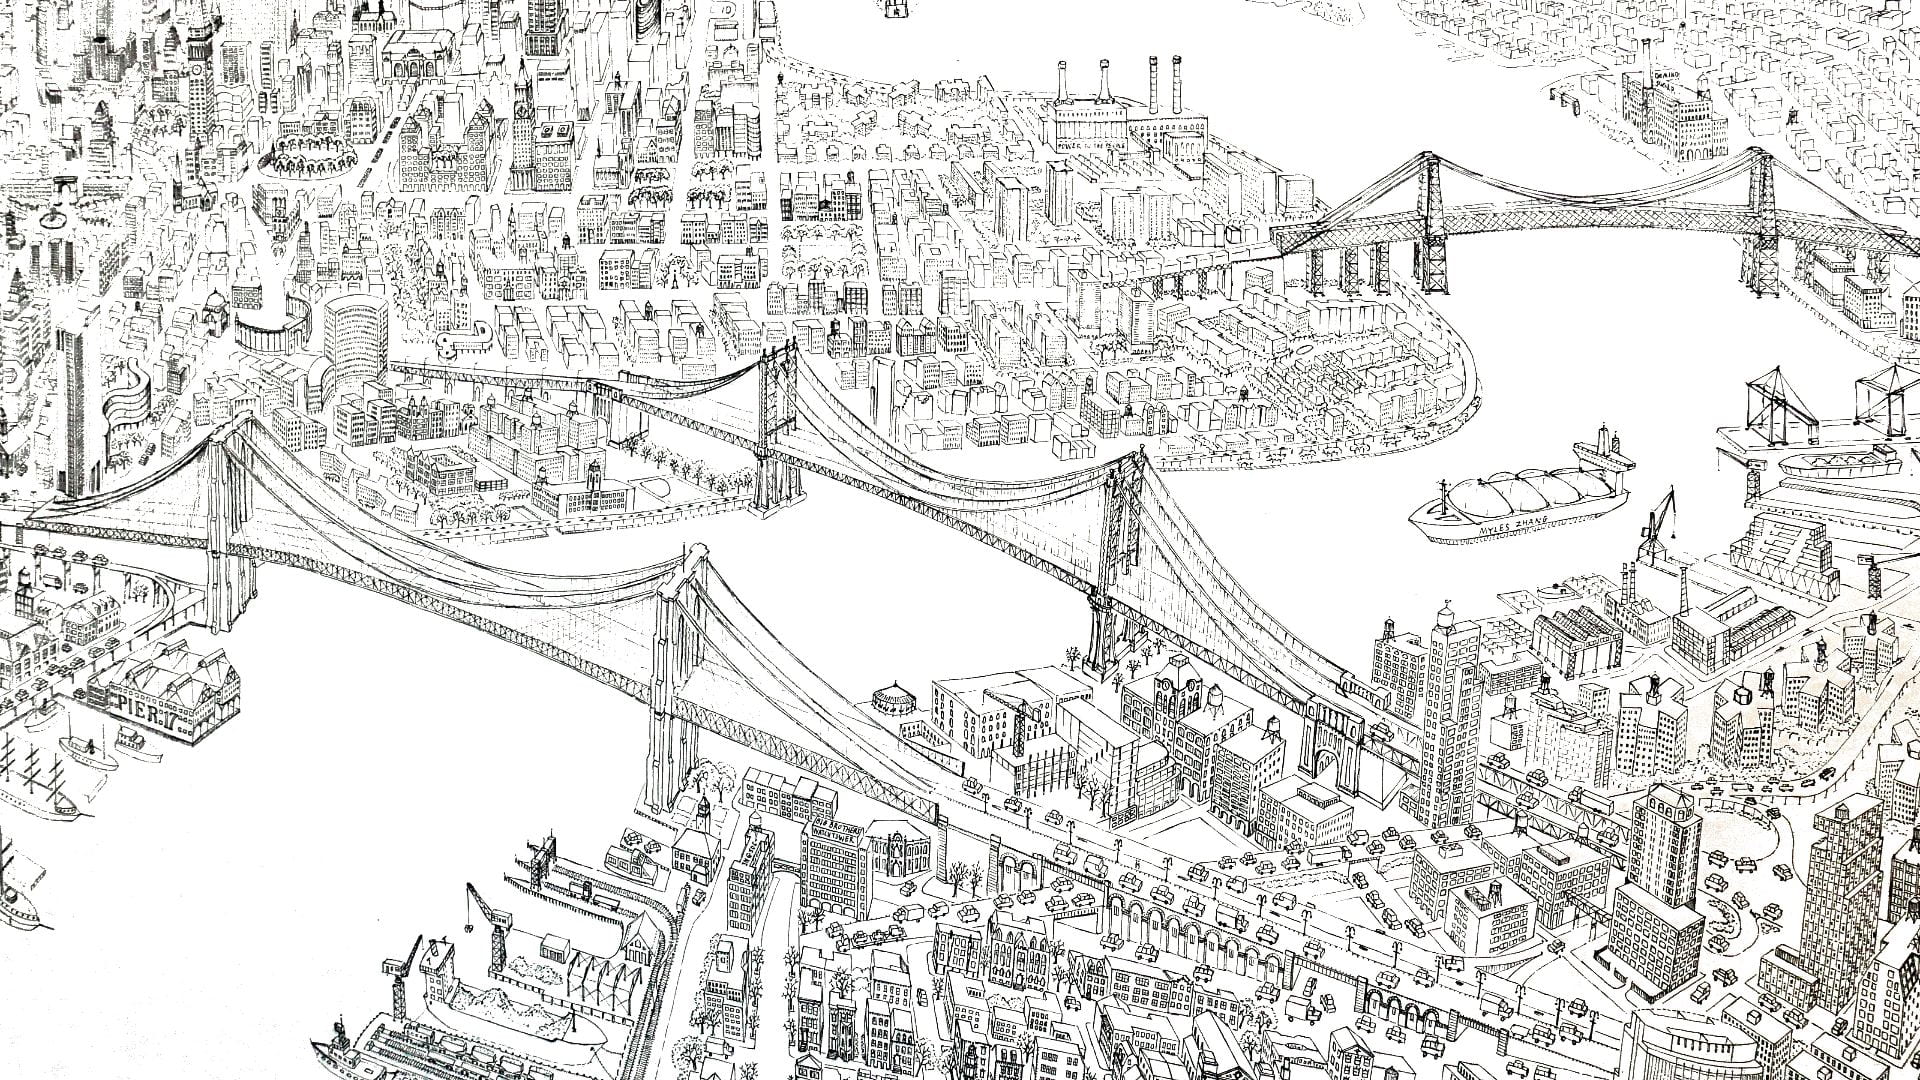
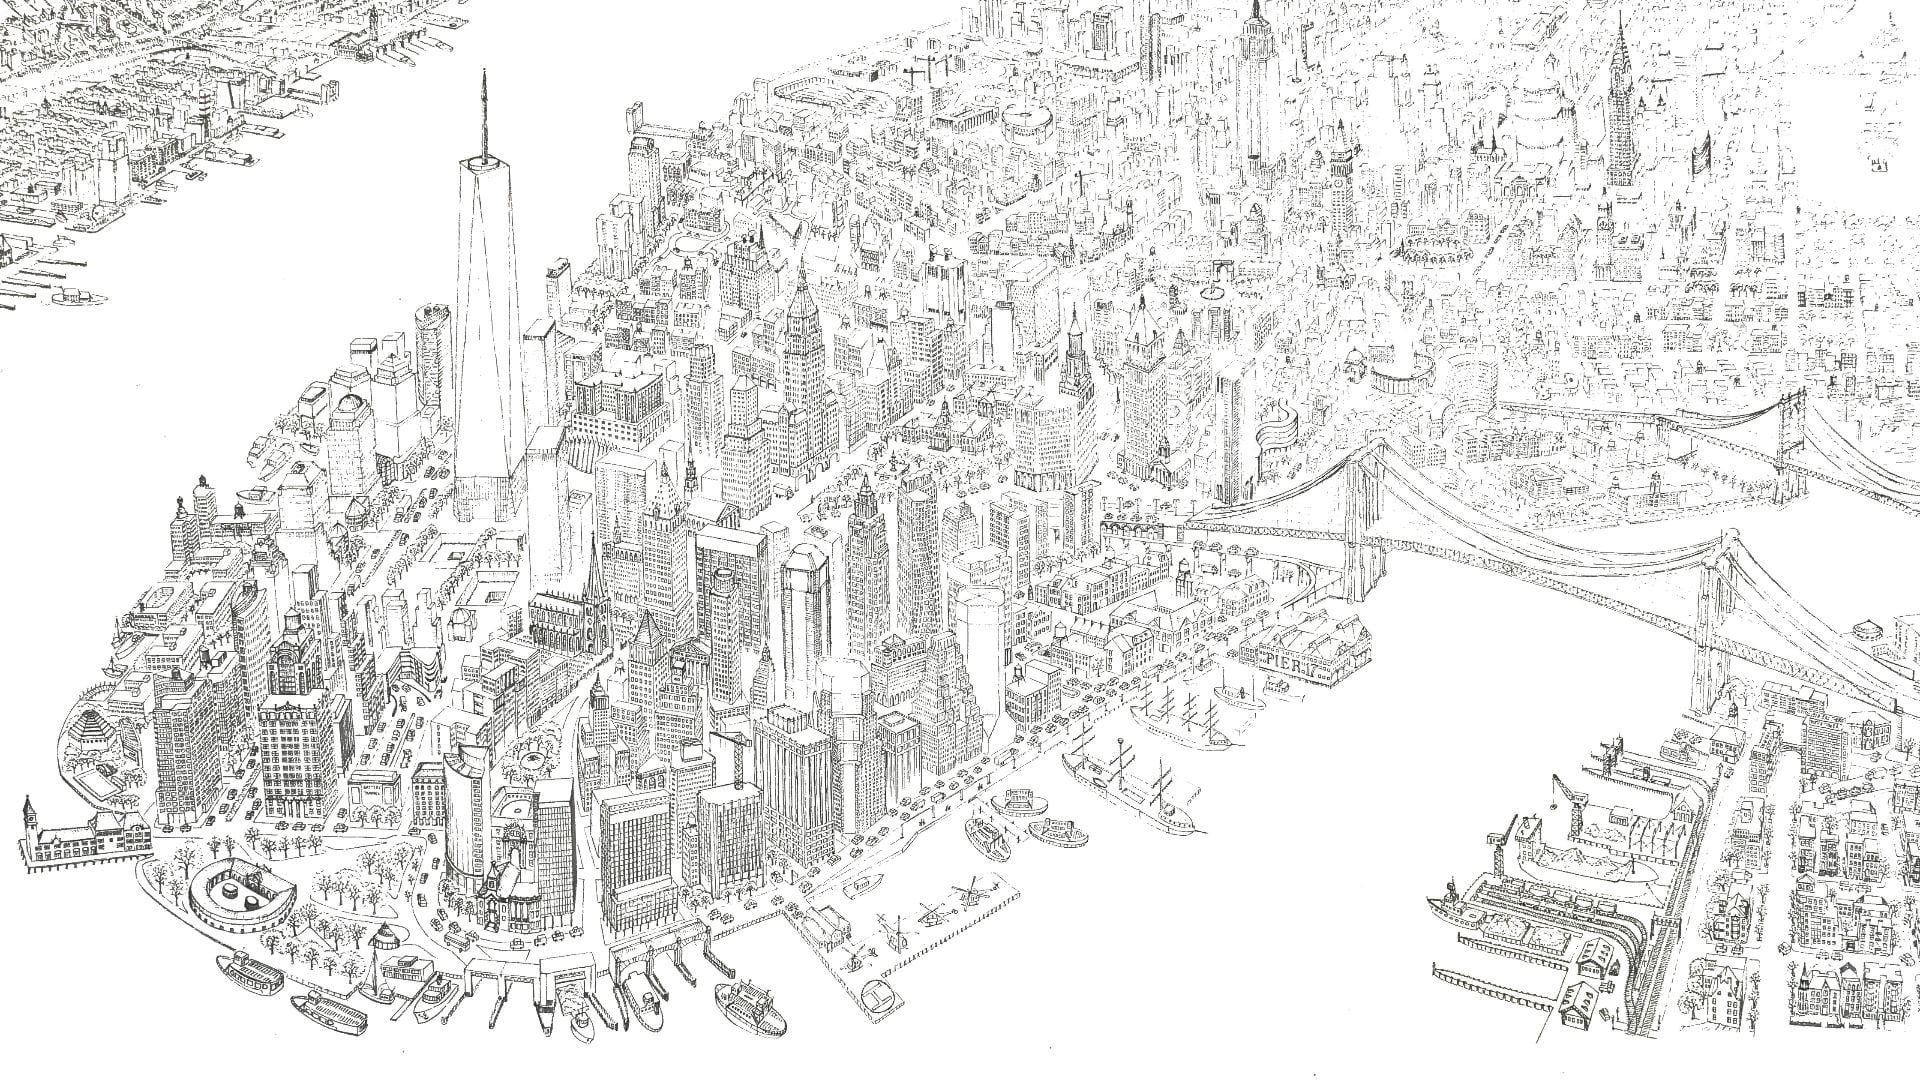
Several hundred maps in the digital archives of the New York Public Library and Library of Congress were analyzed to assemble this film. About 25 of these maps were then selected, downloaded, merged, stretched, and warped in a single document to align with each other. This provided a consistent scale and allowed easier comparison of differences between maps of different date. As the source files were all in different colors, scales, and designs, we created a single base map with unified graphics. The redrawing not only permits correcting errors in less accurate old maps but also provides a graphic representation that is consistent over time. This coherence allows the rate and trends in urban growth to be read more easily and compared between eras.
Or watch the video tutorial below of the workflow and software behind the animation
.
.
4. Conclusions and Analysis
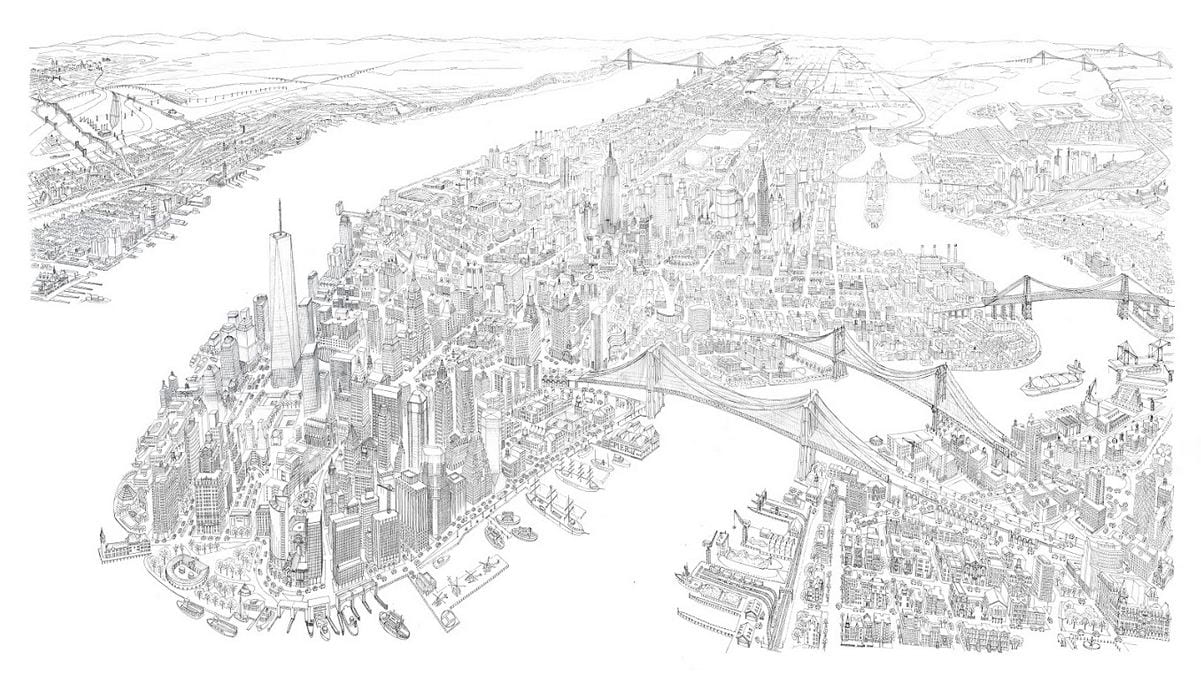
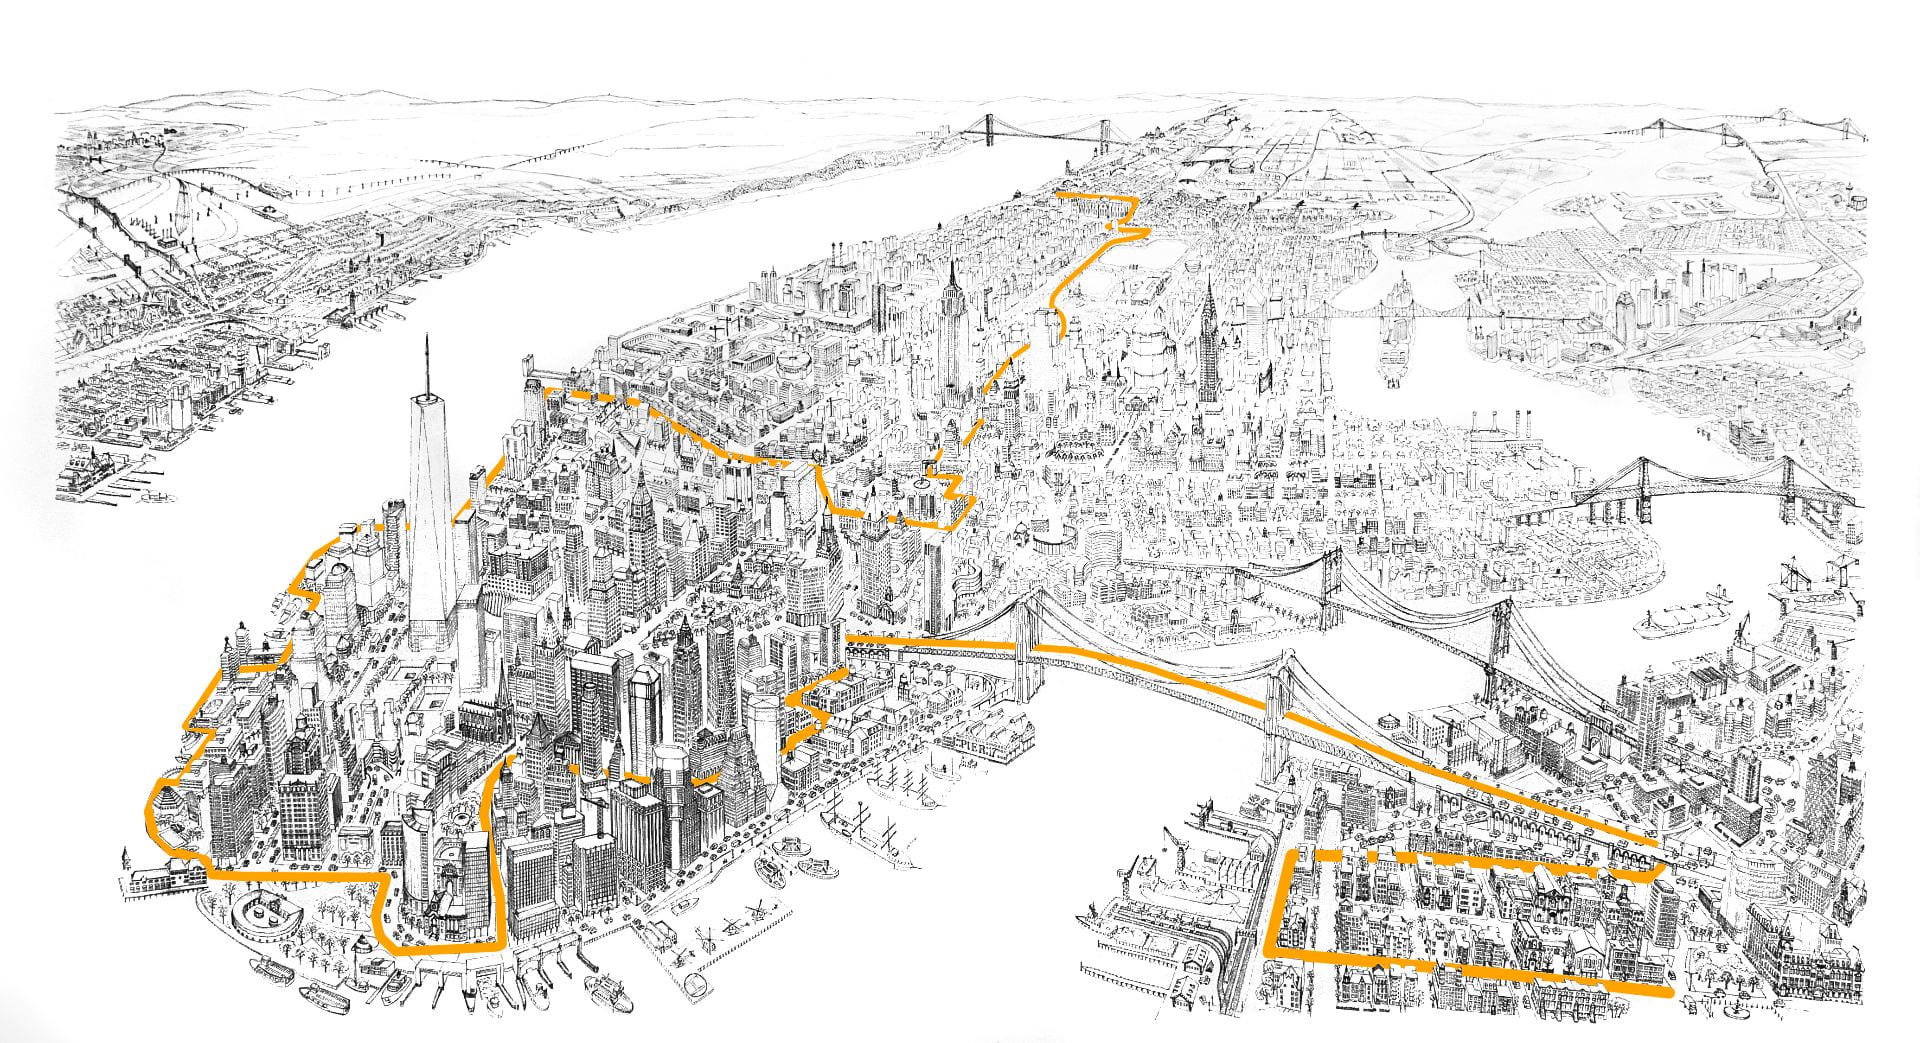
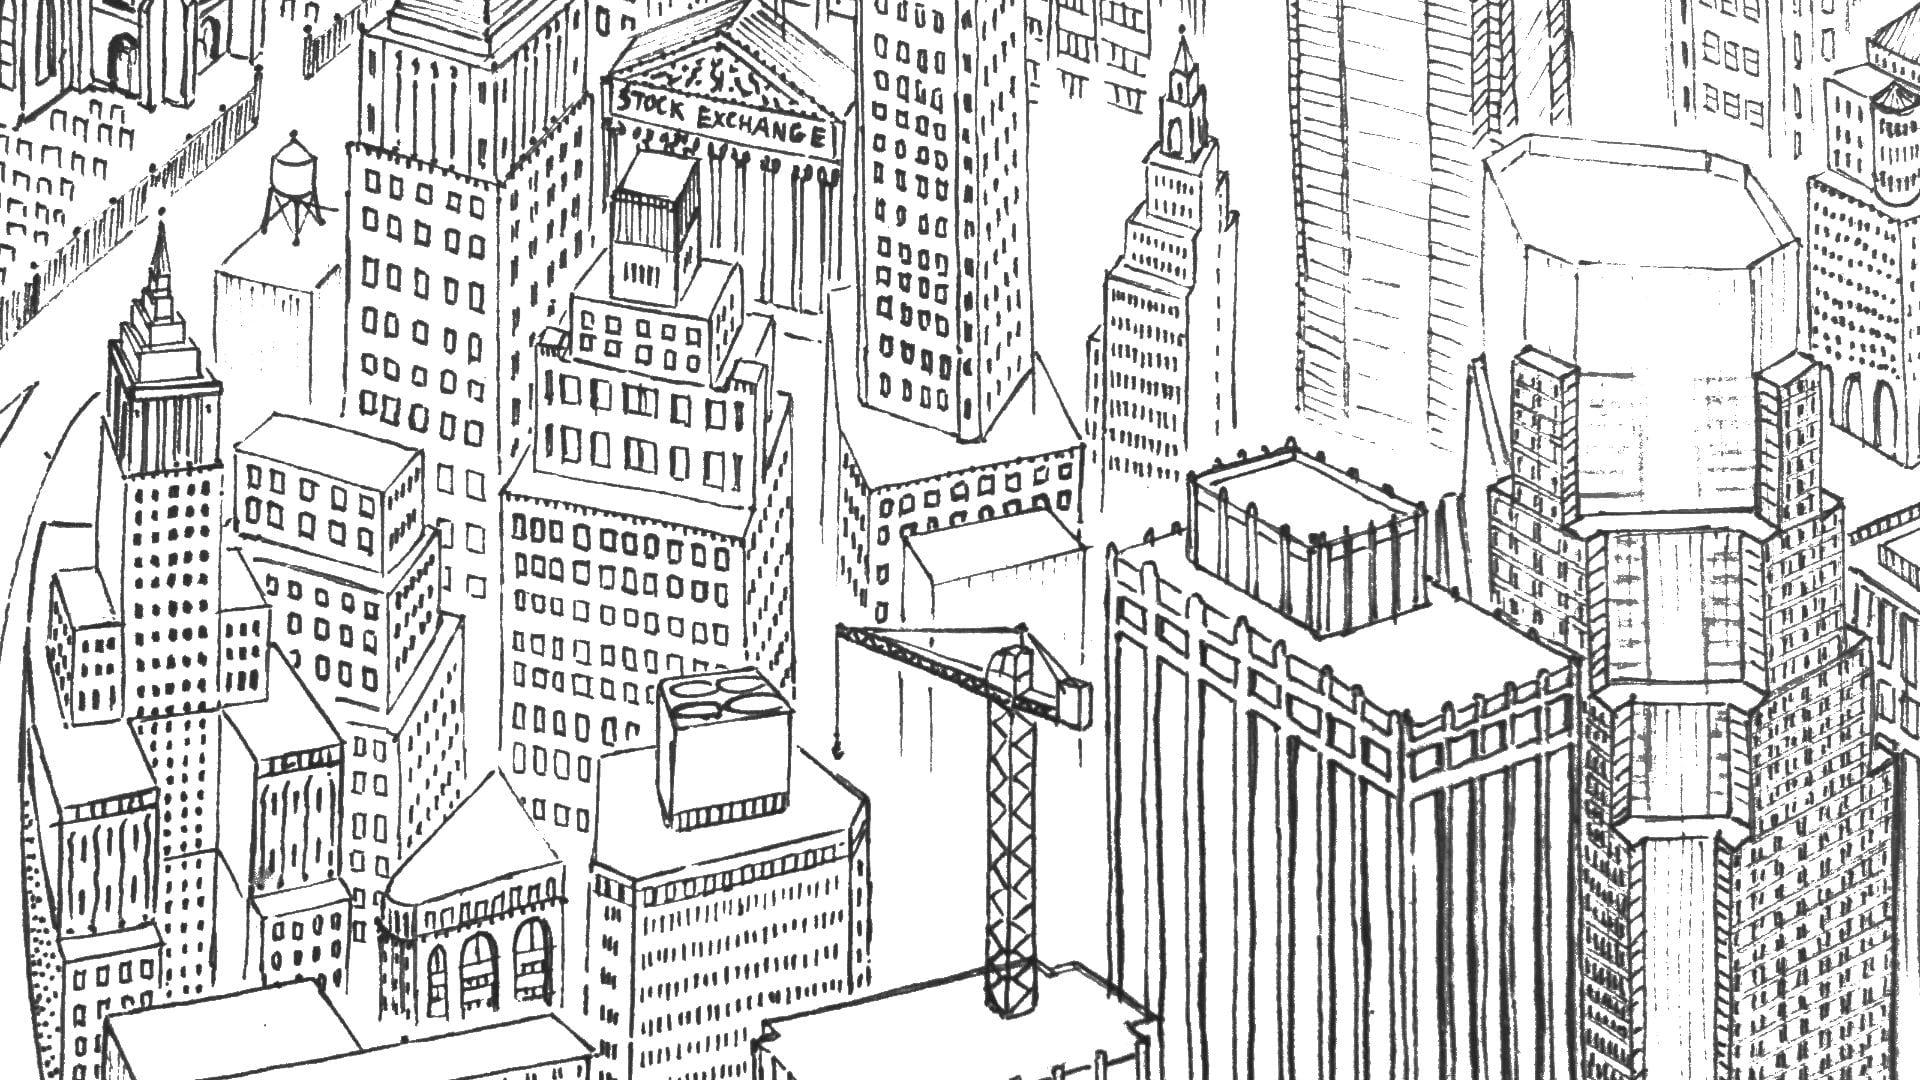
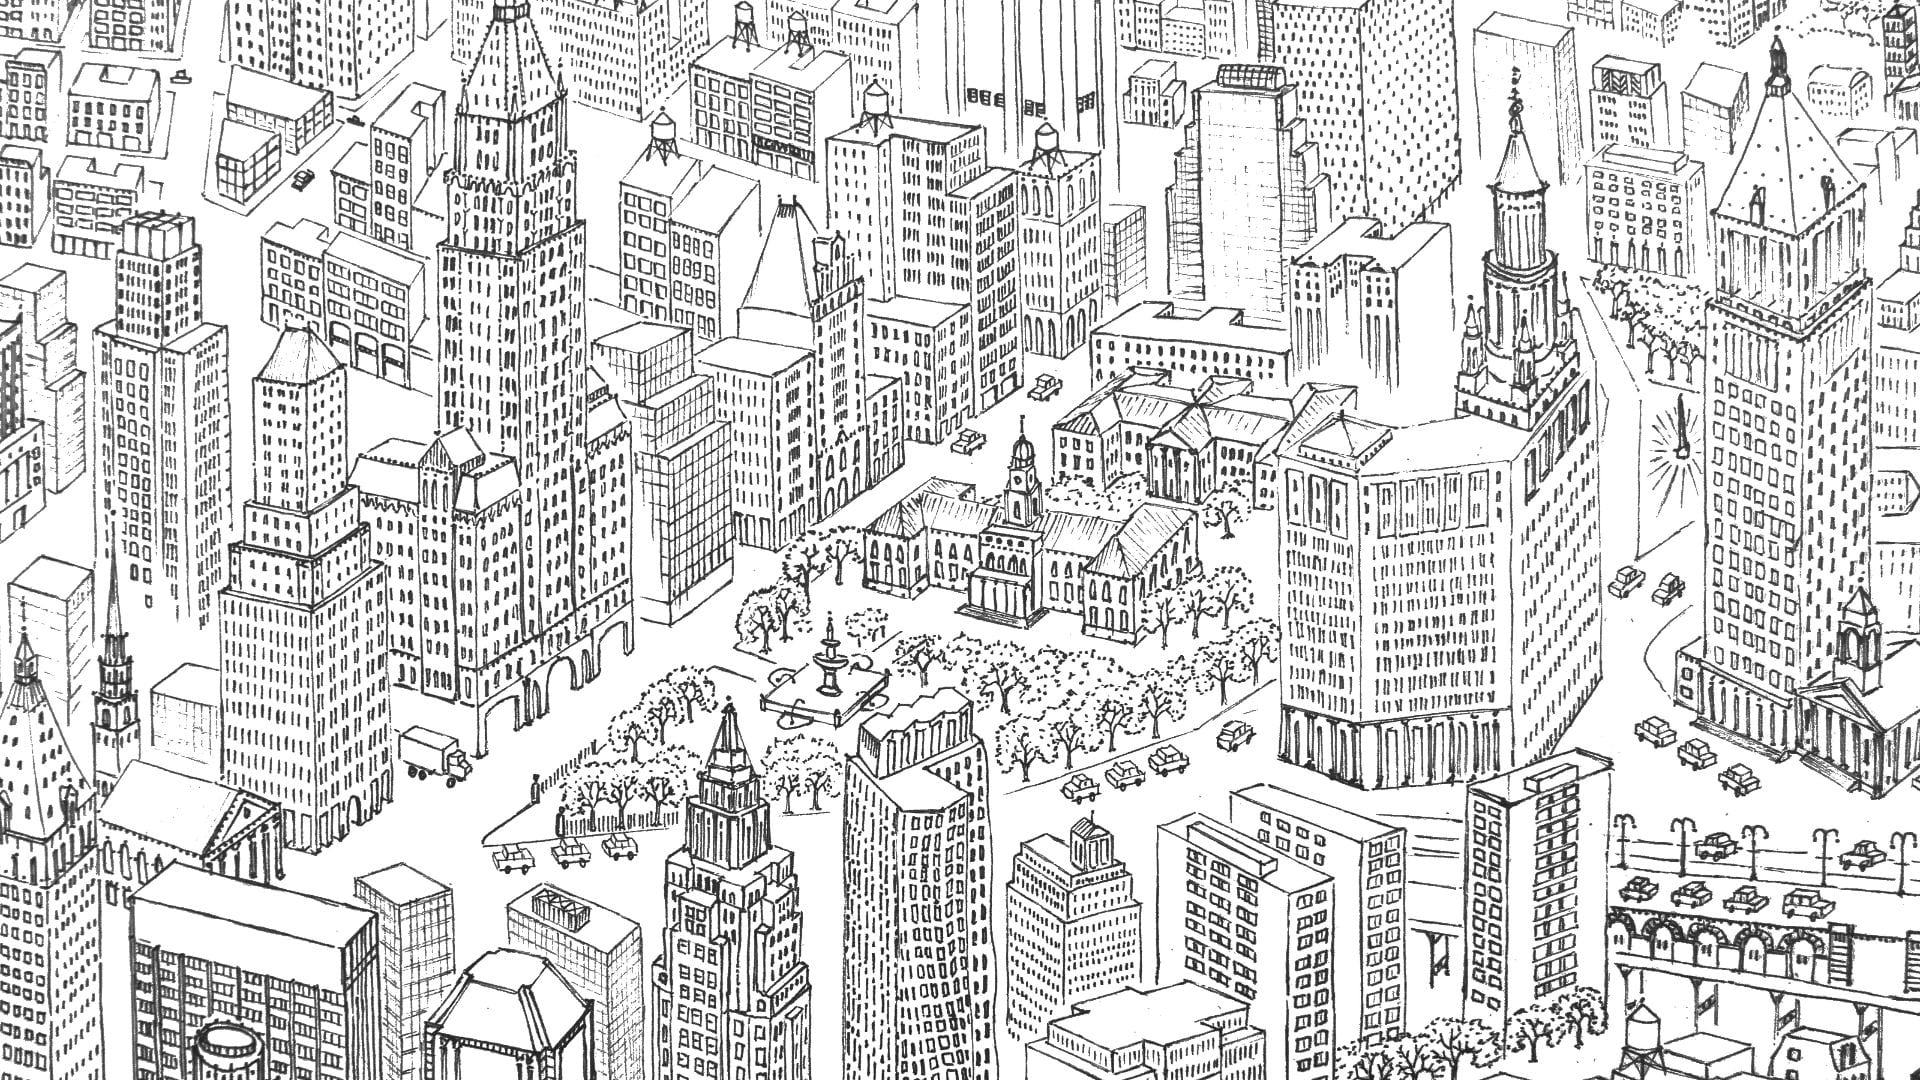
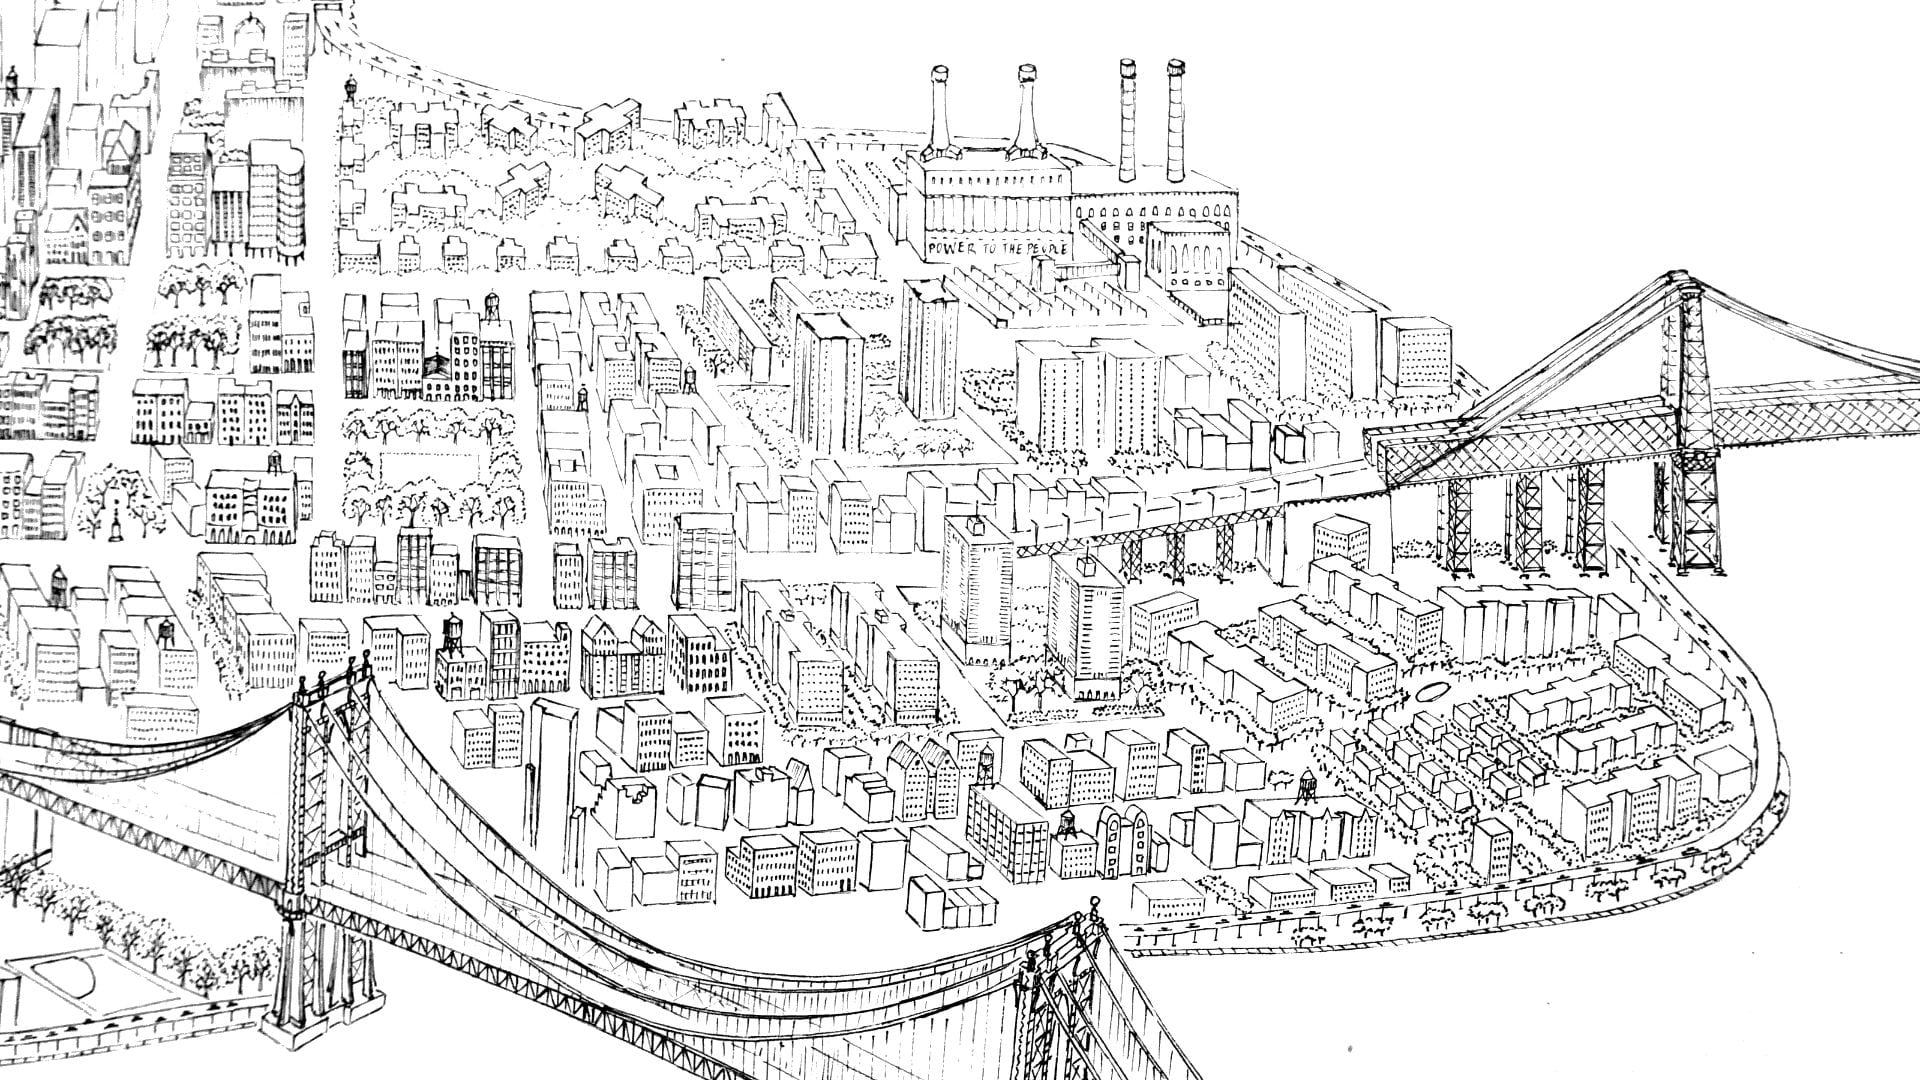
This data visualization informs our analysis of the history of the New York City grid. This analysis reflects on the question: What can the built environment of Manhattan’s streets reflect about the evolving social and economic priorities of city planners and leaders? The long phases of urban growth and shifting transportation modes created distinctive road networks in Manhattan. The predominance of different forms of transport during each era also prompted changes to the location and dimensions of streets in response. Manhattan illustrates the evolution of these road networks over four centuries of near continuous growth. A plot can describe a street grid, as well as its builders’ story. This paper aims to tell this second plot, a story of urbanism.
.
-
-
1857 population 814,000
-
-
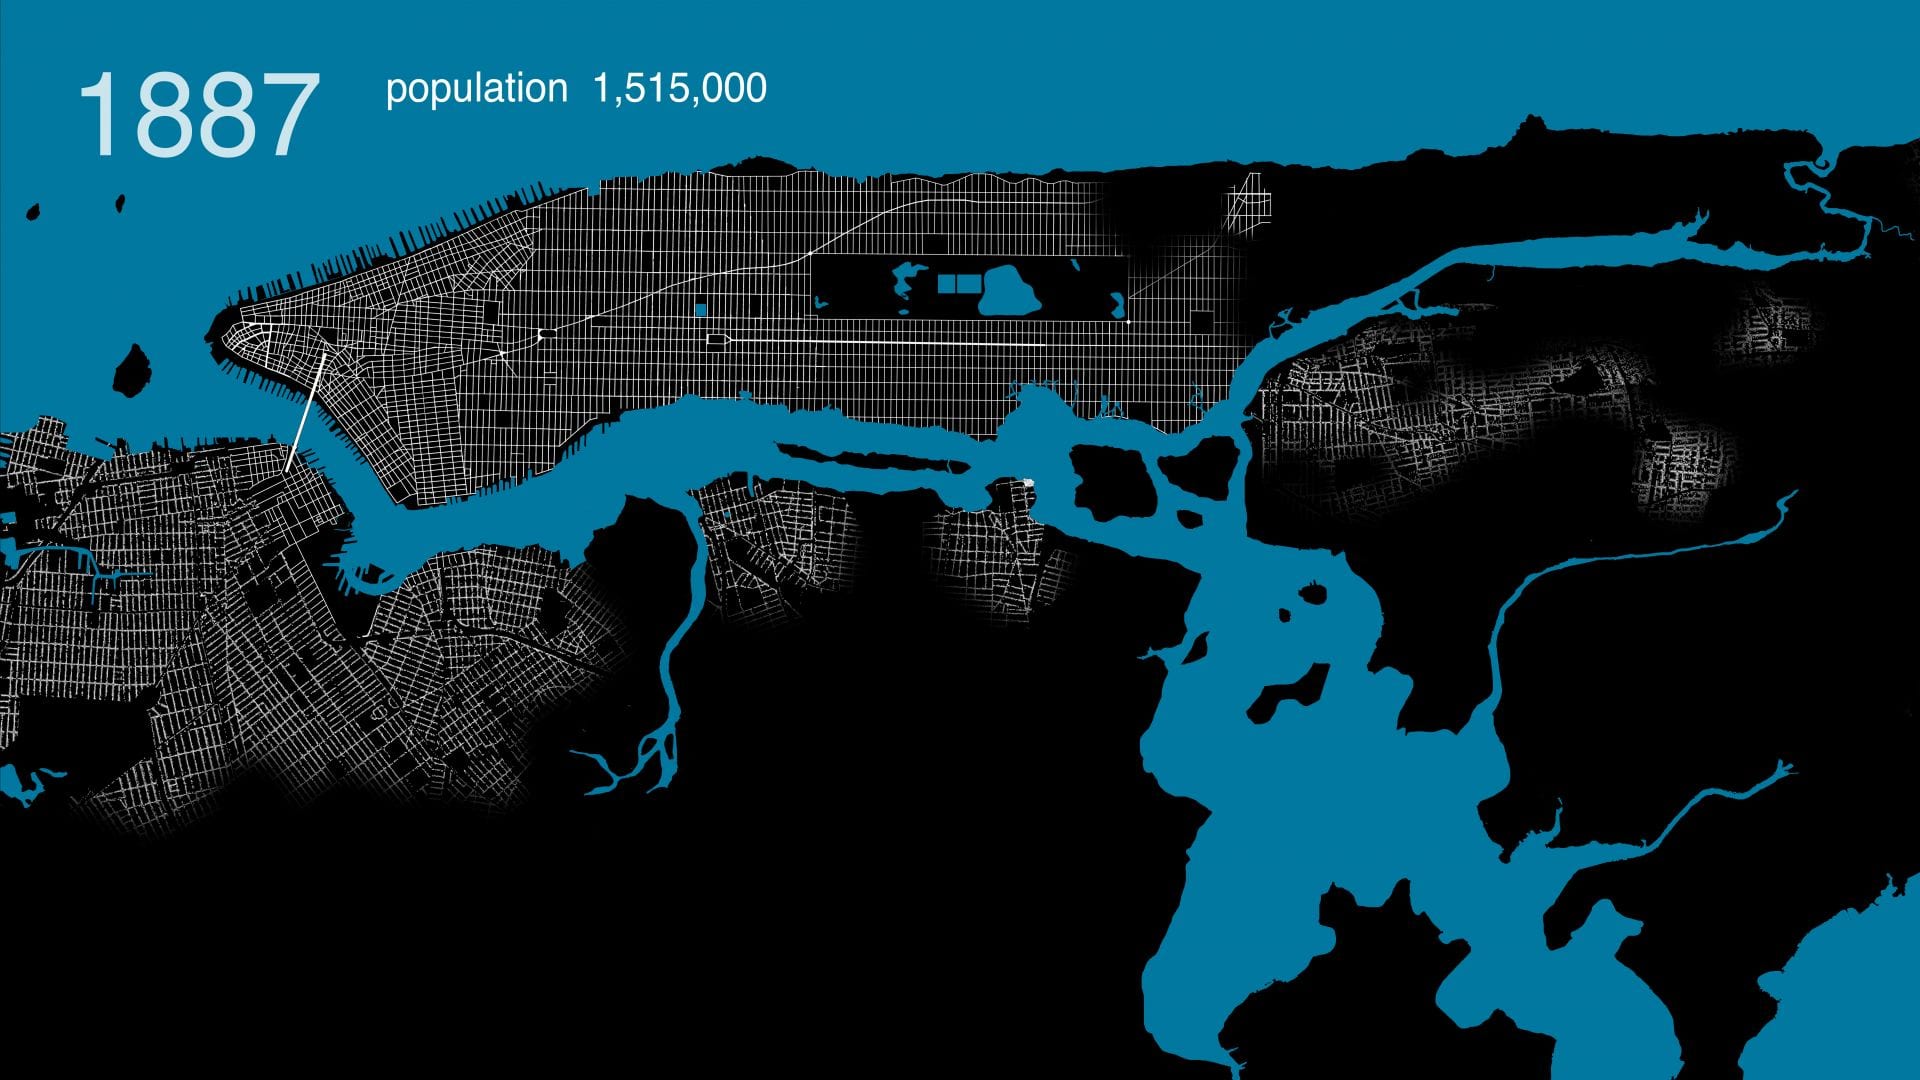
1889 population 1,515,000
-
-
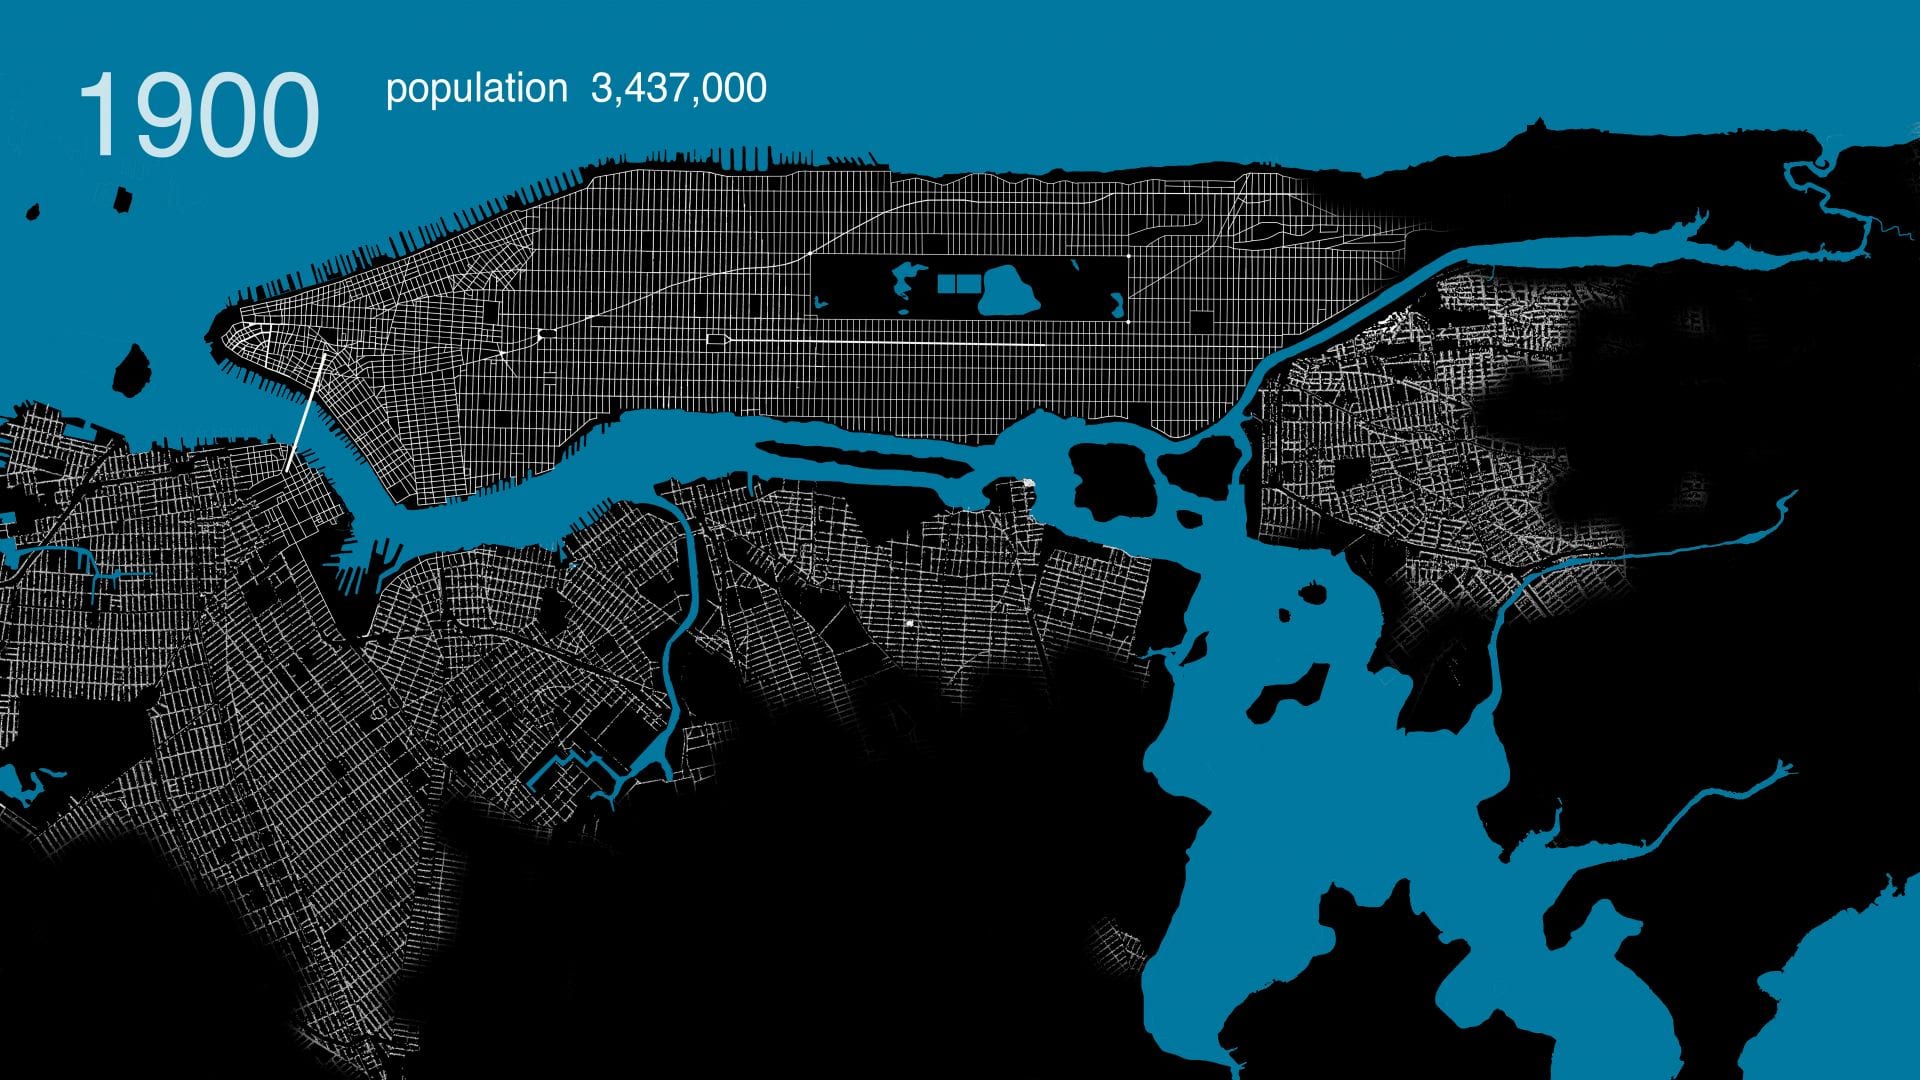
1900 population 3,437,000
-
-
1920 population 5,620,000
-
-
1940 population 7,455,000
.
5. Credits and Appendix
This project would not have been possible without the support, mentorship, and patience of my parents, Anne Mabry and Zemin Zemin Zhang. Nor would this project have been possible without the historical expertise of Columbia University professors Kenneth T. Jackson (History Department) and Gergely Baics (Urban Studies). Thanks is also extended to those who reviewed and critiqued this project in its early stages, including Chris Kok, Wright Kennedy, Dan Miller, and the Center for Spatial Research at Columbia’s Department of History. Most importantly, I thank my dog ChoiChoi.
.
 Anyone may reuse or republish this content, so long as credit is provided with the link back to this page. If you email [email protected], I will gladly send along the graphics, maps, and source files associated.
.


")


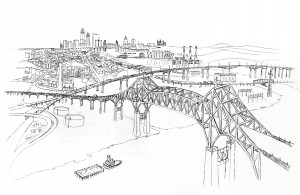

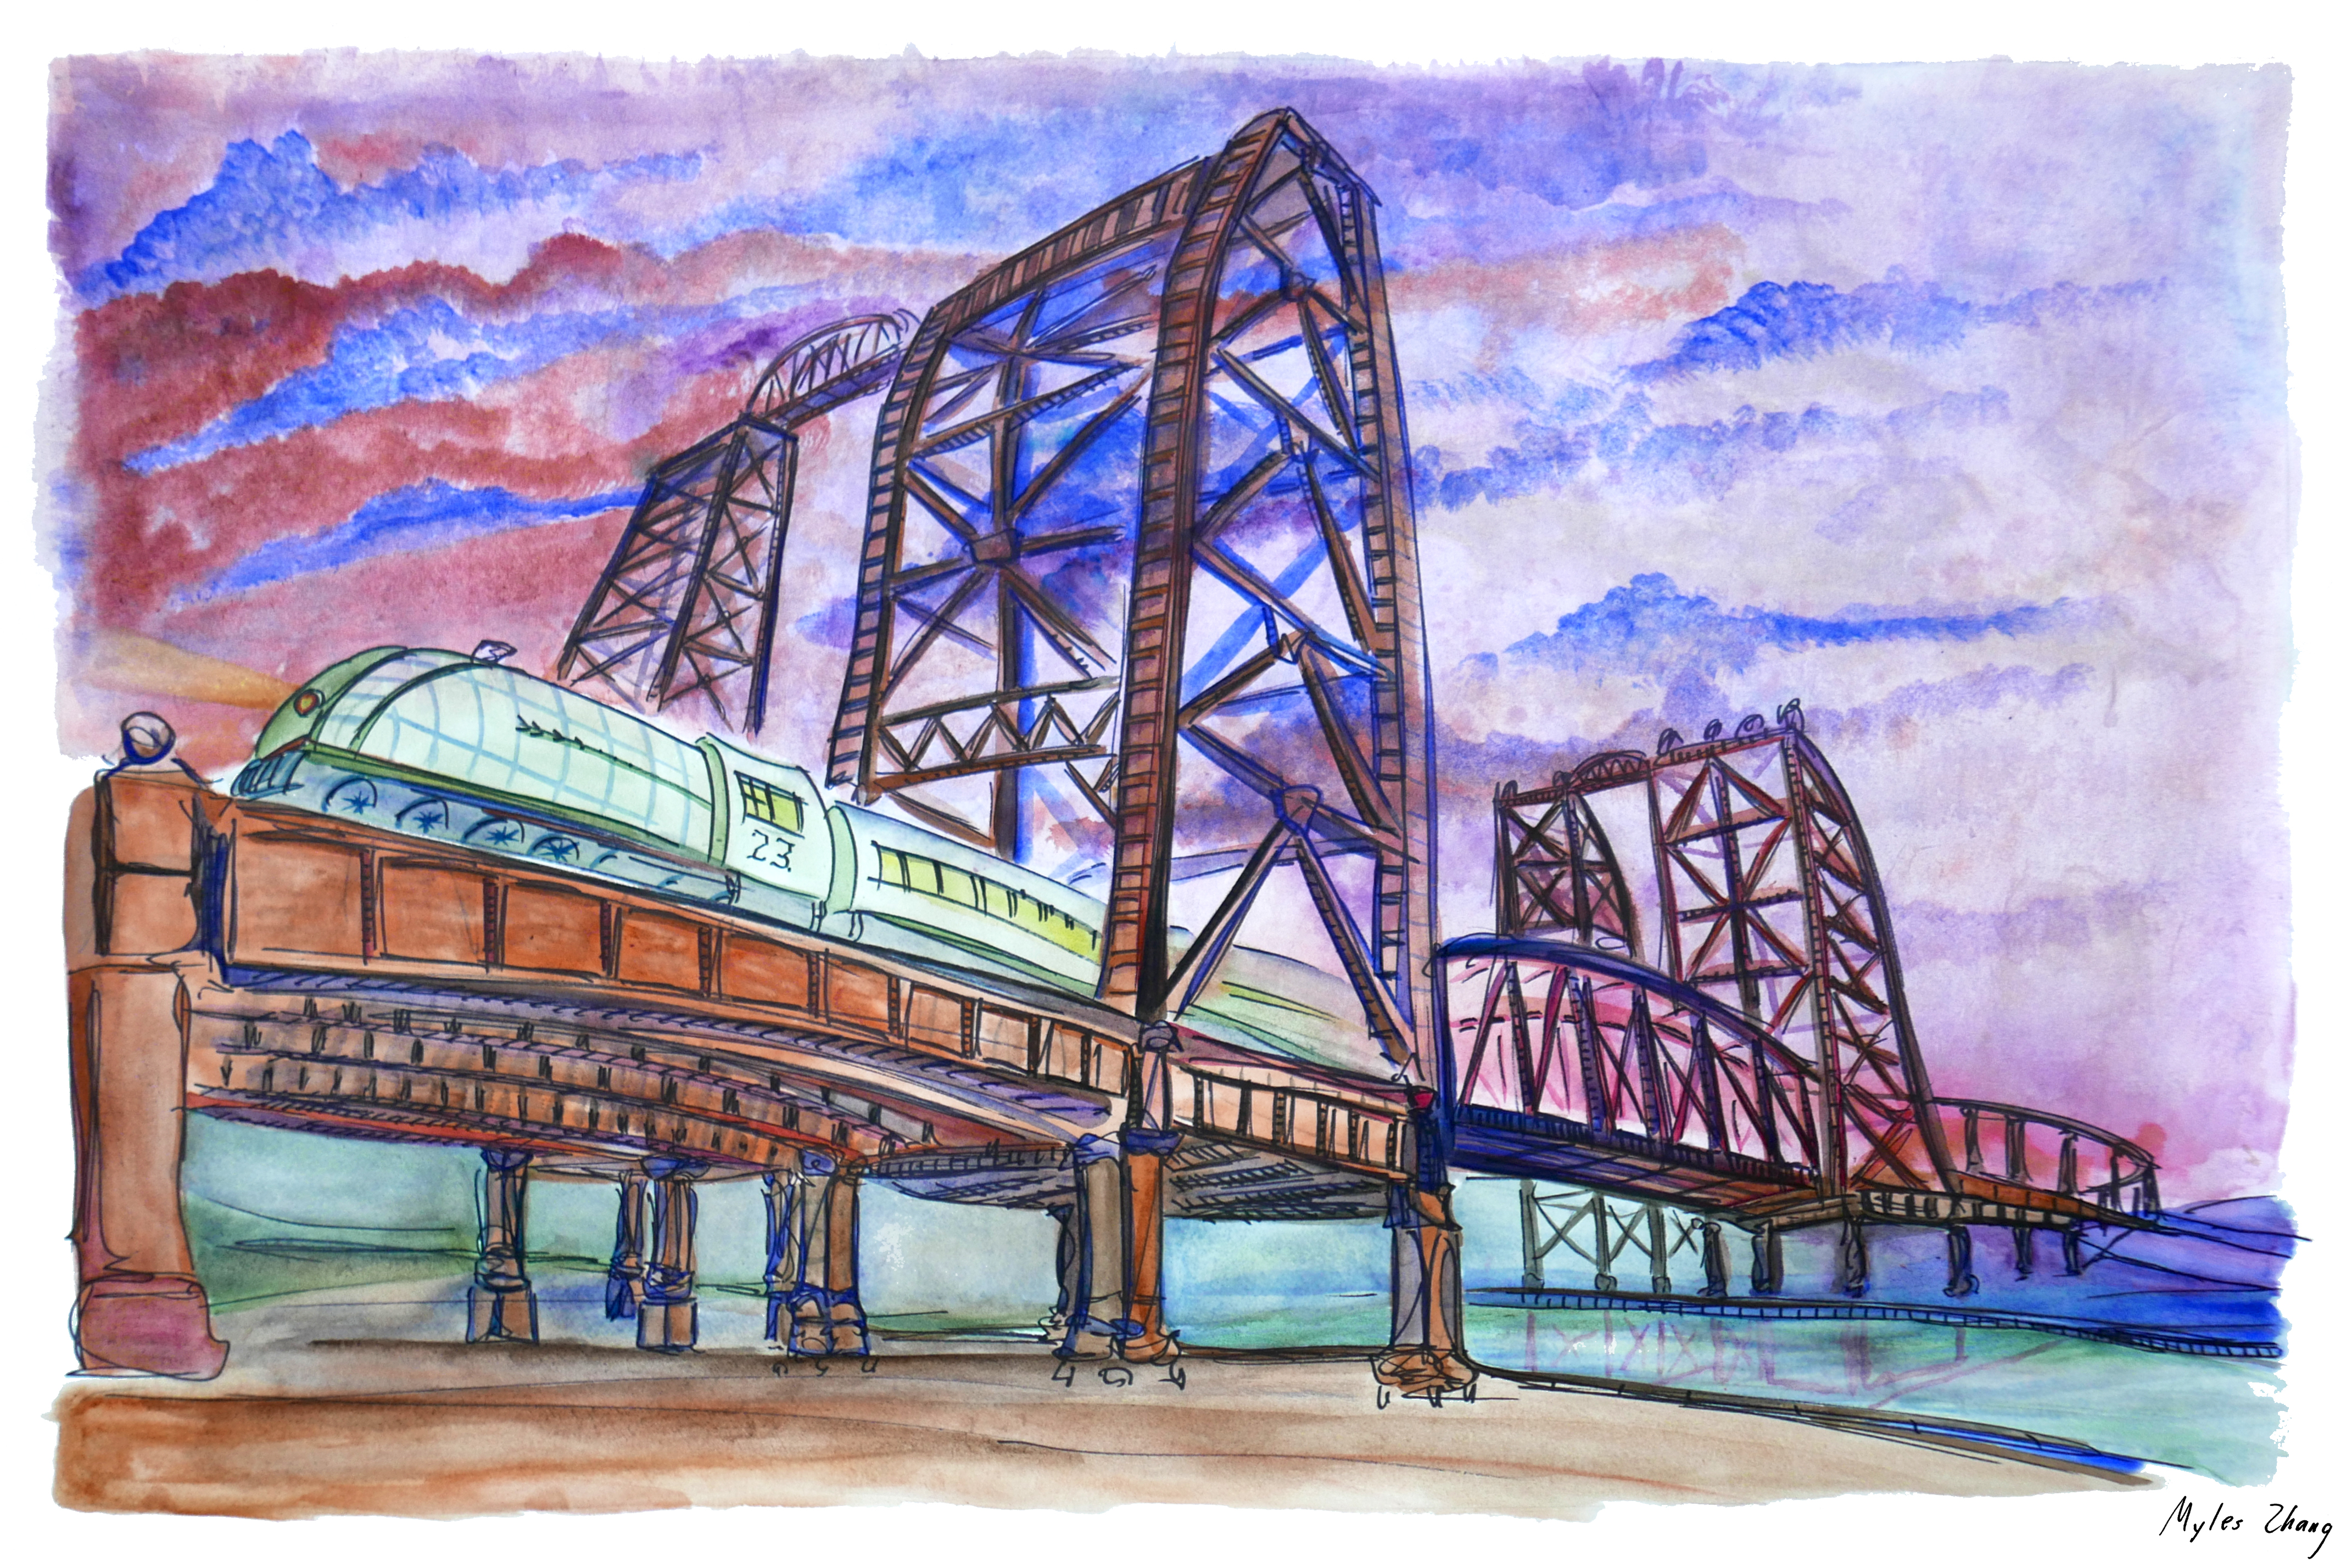


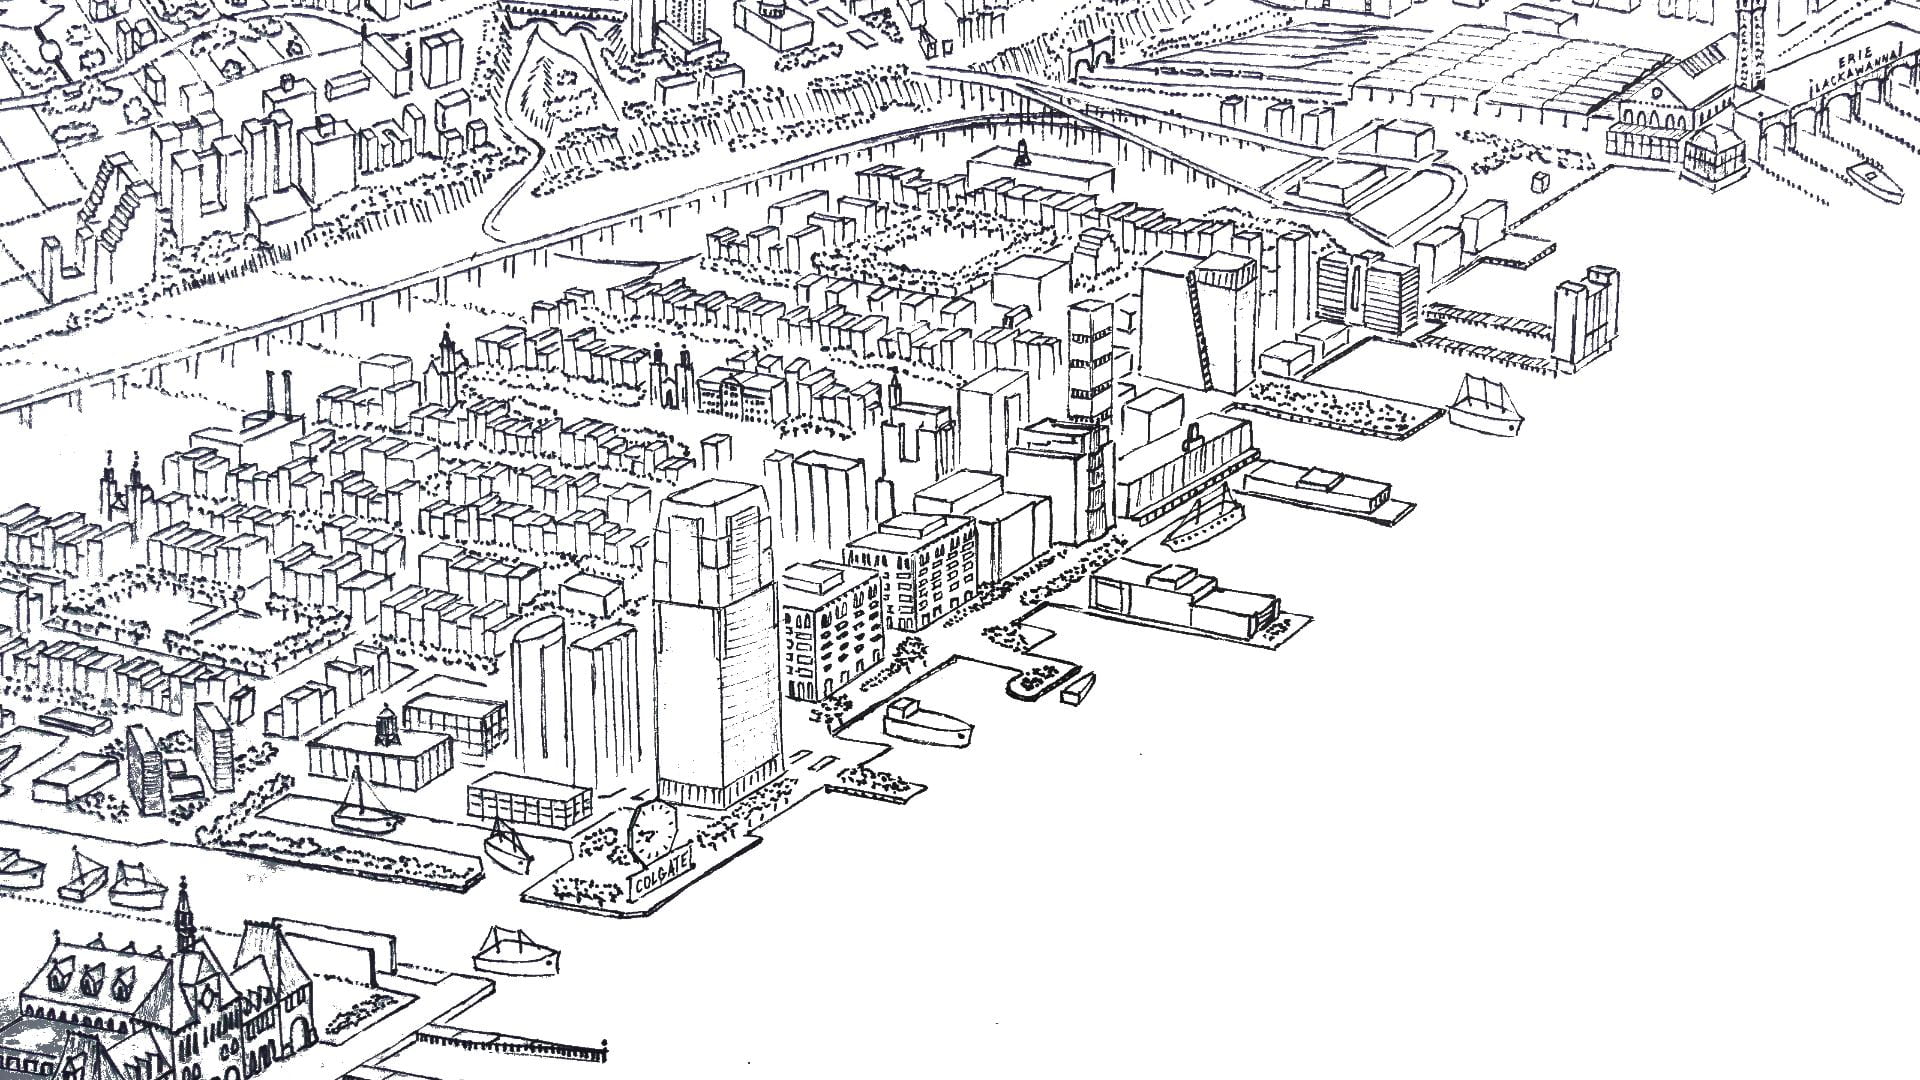
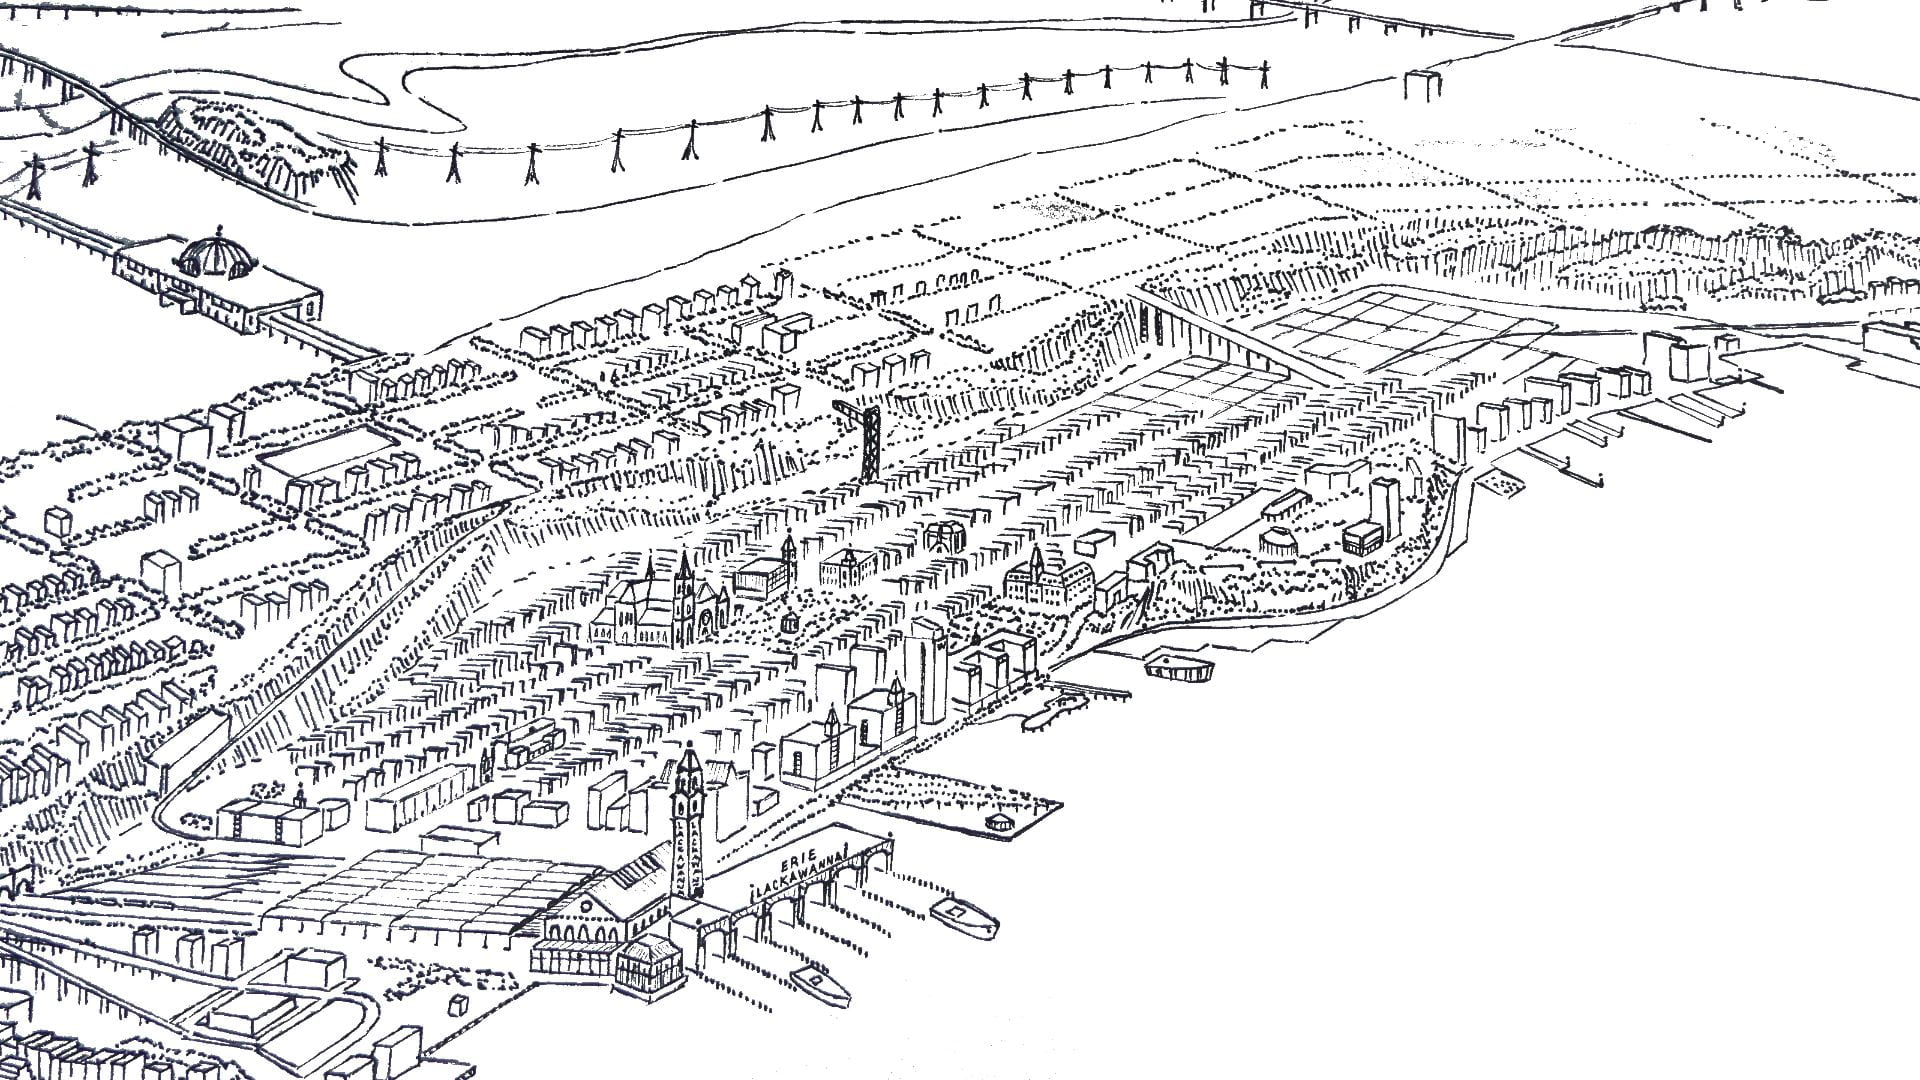
 Newark Skyline from the Passaic River
 Newark Airport
 Panorama of Newark from Roof of 810 Broad Street